

Cellular senescence contributes to age-dependent changes in circulating extracellular vesicle cargo and function
- PMID: 31960578
- PMCID: PMC7059145
- DOI: 10.1111/acel.13103
Cellular senescence contributes to age-dependent changes in circulating extracellular vesicle cargo and function
Abstract
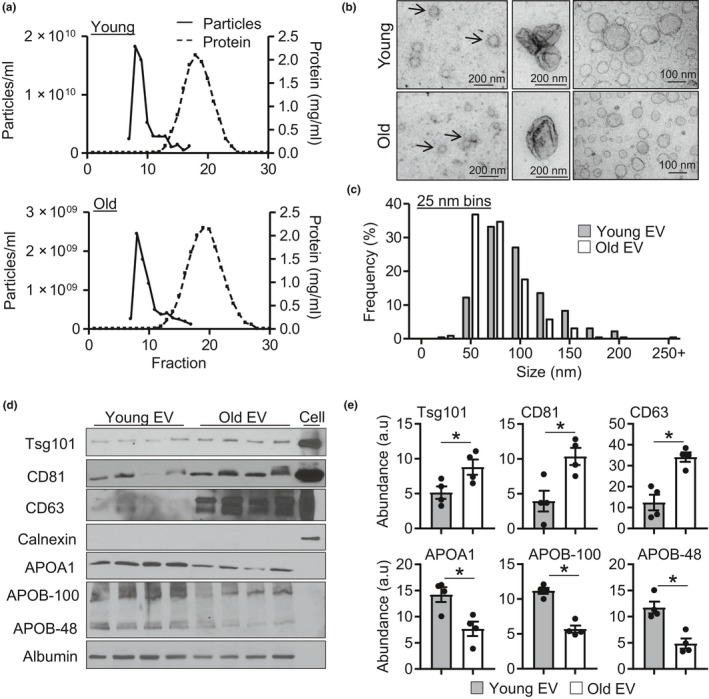
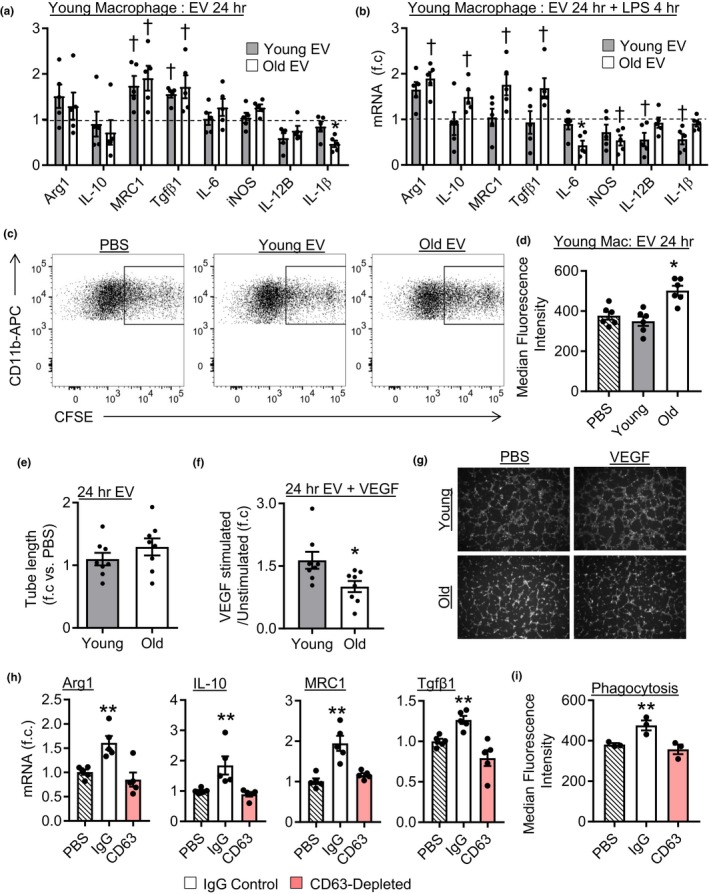
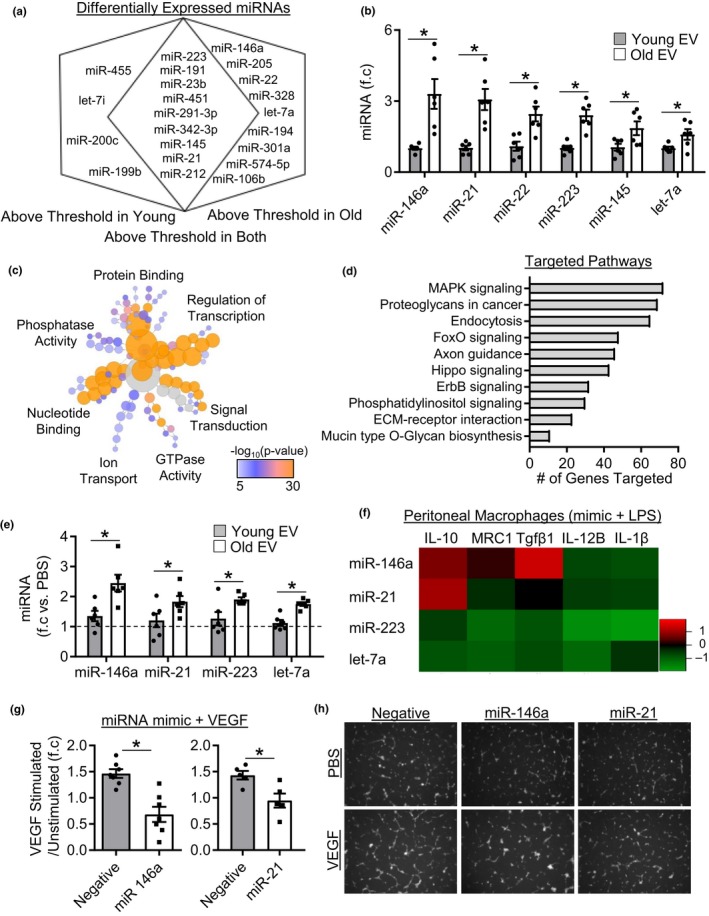
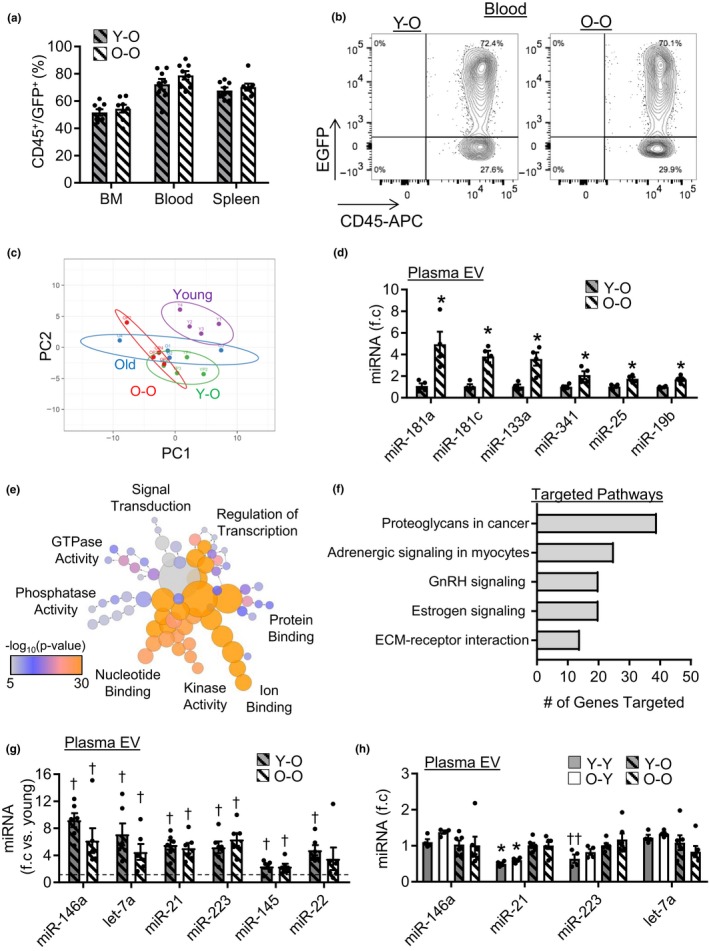
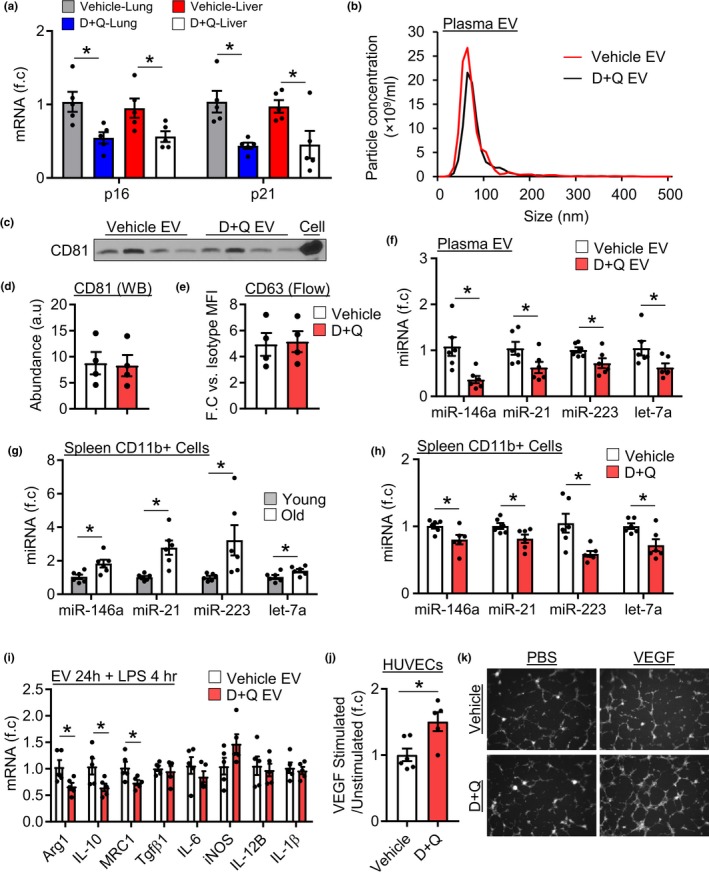
Extracellular vesicles (EVs) have emerged as important regulators of inter-cellular and inter-organ communication, in part via the transfer of their cargo to recipient cells. Although circulating EVs have been previously studied as biomarkers of aging, how circulating EVs change with age and the underlying mechanisms that contribute to these changes are poorly understood. Here, we demonstrate that aging has a profound effect on the circulating EV pool, as evidenced by changes in concentration, size, and cargo. Aging also alters particle function; treatment of cells with EV fractions isolated from old plasma reduces macrophage responses to lipopolysaccharide, increases phagocytosis, and reduces endothelial cell responses to vascular endothelial growth factor compared to cells treated with young EV fractions. Depletion studies indicate that CD63+ particles mediate these effects. Treatment of macrophages with EV-like particles revealed that old particles increased the expression of EV miRNAs in recipient cells. Transfection of cells with microRNA mimics recapitulated some of the effects seen with old EV-like particles. Investigation into the underlying mechanisms using bone marrow transplant studies revealed circulating cell age does not substantially affect the expression of aging-associated circulating EV miRNAs in old mice. Instead, we show that cellular senescence contributes to changes in particle cargo and function. Notably, senolytic treatment of old mice shifted plasma particle cargo and function toward that of a younger phenotype. Collectively, these results demonstrate that senescent cells contribute to changes in plasma EVs with age and suggest a new mechanism by which senescent cells can affect cellular functions throughout the body.
Keywords: aging; extracellular vesicles; microRNA; plasma; senescence; senolytic.
© 2020 The Authors. Aging Cell published by the Anatomical Society and John Wiley & Sons Ltd.
Conflict of interest statement
None declared.
Figures

Similar articles
-
MicroRNA-183-5p Increases with Age in Bone-Derived Extracellular Vesicles, Suppresses Bone Marrow Stromal (Stem) Cell Proliferation, and Induces Stem Cell Senescence.Tissue Eng Part A. 2017 Nov;23(21-22):1231-1240. doi: 10.1089/ten.TEA.2016.0525. Epub 2017 Apr 28. Tissue Eng Part A. 2017. PMID: 28363268 Free PMC article.
-
MicroRNA Cargo of Extracellular Vesicles from Alcohol-exposed Monocytes Signals Naive Monocytes to Differentiate into M2 Macrophages.J Biol Chem. 2016 Jan 1;291(1):149-59. doi: 10.1074/jbc.M115.694133. Epub 2015 Nov 2. J Biol Chem. 2016. PMID: 26527689 Free PMC article.
-
Hepatocyte-derived extracellular vesicles promote endothelial inflammation and atherogenesis via microRNA-1.J Hepatol. 2020 Jan;72(1):156-166. doi: 10.1016/j.jhep.2019.09.014. Epub 2019 Sep 27. J Hepatol. 2020. PMID: 31568800
-
Extracellular Vesicles in Aging: An Emerging Hallmark?Cells. 2023 Feb 6;12(4):527. doi: 10.3390/cells12040527. Cells. 2023. PMID: 36831194 Free PMC article. Review.
-
Emerging role of extracellular vesicles as a senescence-associated secretory phenotype: Insights into the pathophysiology of lung diseases.Mol Aspects Med. 2018 Apr;60:92-103. doi: 10.1016/j.mam.2017.11.005. Epub 2017 Nov 20. Mol Aspects Med. 2018. PMID: 29146100 Review.
Cited by
-
Endothelial senescence mediates hypoxia-induced vascular remodeling by modulating PDGFB expression.Front Med (Lausanne). 2022 Sep 20;9:908639. doi: 10.3389/fmed.2022.908639. eCollection 2022. Front Med (Lausanne). 2022. PMID: 36203755 Free PMC article.
-
Isolation methodology is essential to the evaluation of the extracellular vesicle component of the senescence-associated secretory phenotype.J Extracell Vesicles. 2021 Feb;10(4):e12041. doi: 10.1002/jev2.12041. Epub 2021 Feb 18. J Extracell Vesicles. 2021. PMID: 33659050 Free PMC article.
-
Behind the Scenes of Extracellular Vesicle Therapy for Skin Injuries and Disorders.Adv Wound Care (New Rochelle). 2022 Nov;11(11):575-597. doi: 10.1089/wound.2021.0066. Epub 2021 Dec 30. Adv Wound Care (New Rochelle). 2022. PMID: 34806432 Free PMC article. Review.
-
Impact of Senescent Cell Subtypes on Tissue Dysfunction and Repair: Importance and Research Questions.Mech Ageing Dev. 2021 Sep;198:111548. doi: 10.1016/j.mad.2021.111548. Epub 2021 Aug 2. Mech Ageing Dev. 2021. PMID: 34352325 Free PMC article. Review.
-
The Role of Extracellular Vesicles as a Shared Disease Mechanism Contributing to Multimorbidity in Patients With COPD.Front Immunol. 2021 Dec 2;12:754004. doi: 10.3389/fimmu.2021.754004. eCollection 2021. Front Immunol. 2021. PMID: 34925327 Free PMC article. Review.
References
-
- Arraud, N. , Linares, R. , Tan, S. , Gounou, C. , Pasquet, J. M. , Mornet, S. , & Brisson, A. R. (2014). Extracellular vesicles from blood plasma: Determination of their morphology, size, phenotype and concentration. Journal of Thrombosis and Haemostasis, 12(5), 614–627. 10.1111/jth.12554 - DOI - PubMed
Publication types
MeSH terms
Substances
Grants and funding
LinkOut - more resources
Full Text Sources
Medical
Molecular Biology Databases
Miscellaneous
