

Expanded circulating hematopoietic stem/progenitor cells as novel cell source for the treatment of TCIRG1 osteopetrosis
- PMID: 31949009
- PMCID: PMC7776247
- DOI: 10.3324/haematol.2019.238261
Expanded circulating hematopoietic stem/progenitor cells as novel cell source for the treatment of TCIRG1 osteopetrosis
Abstract
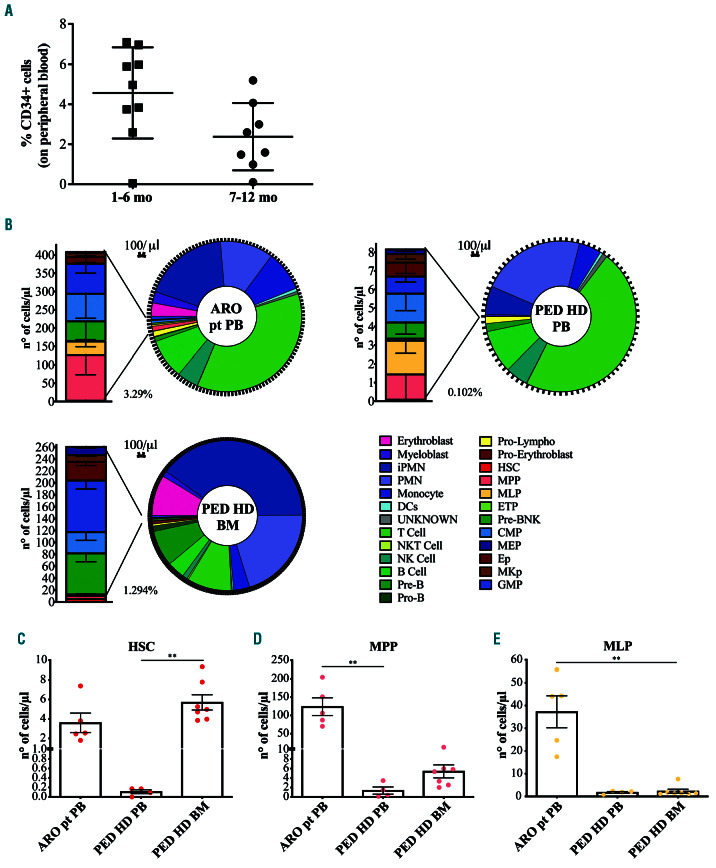
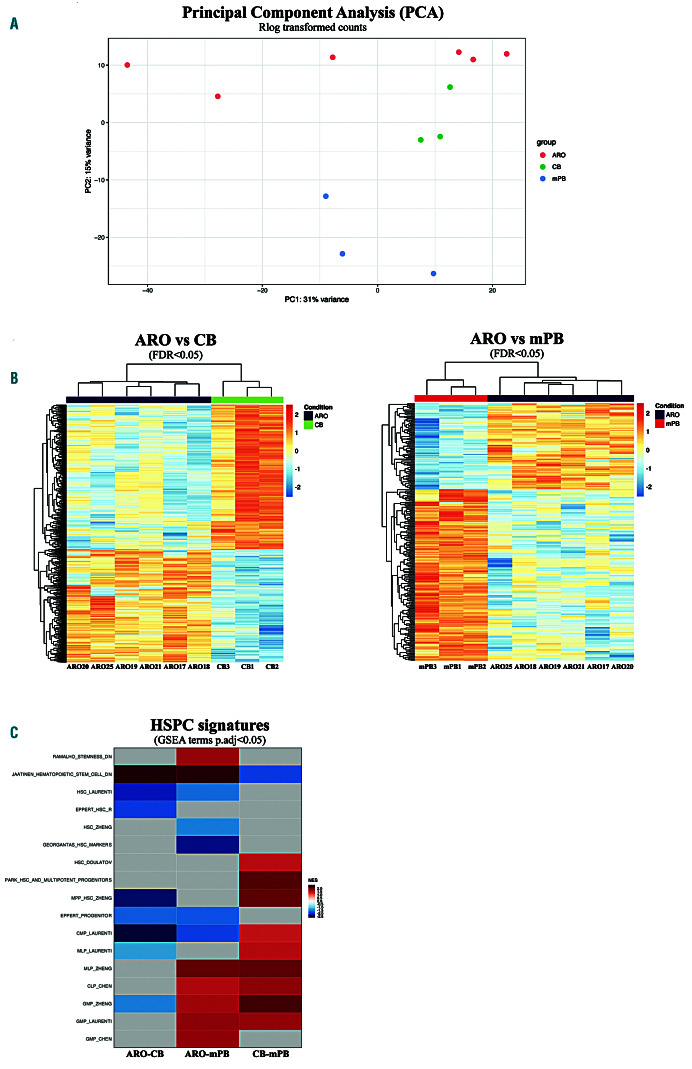
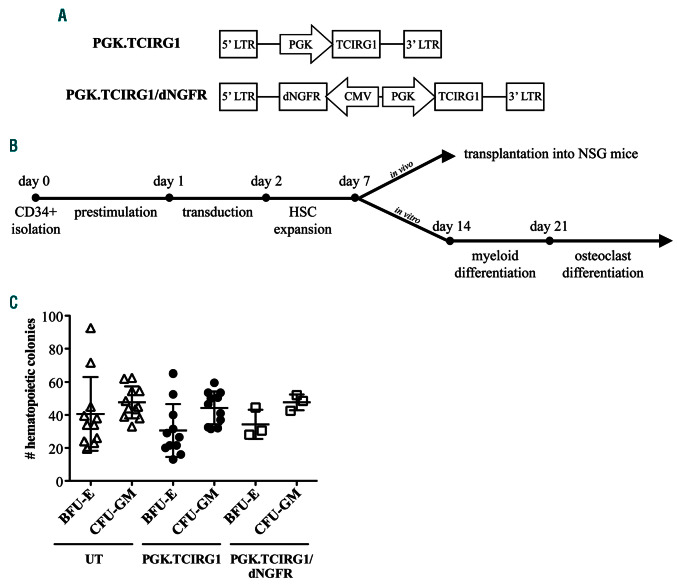
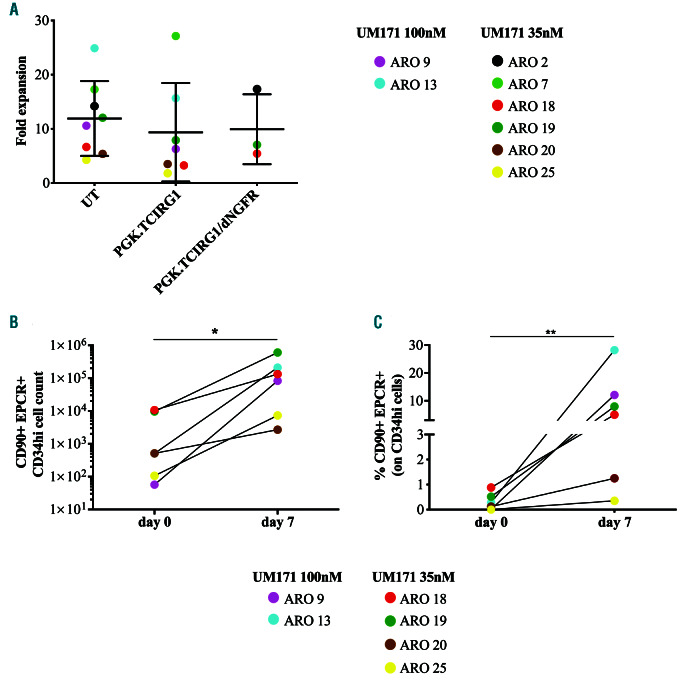
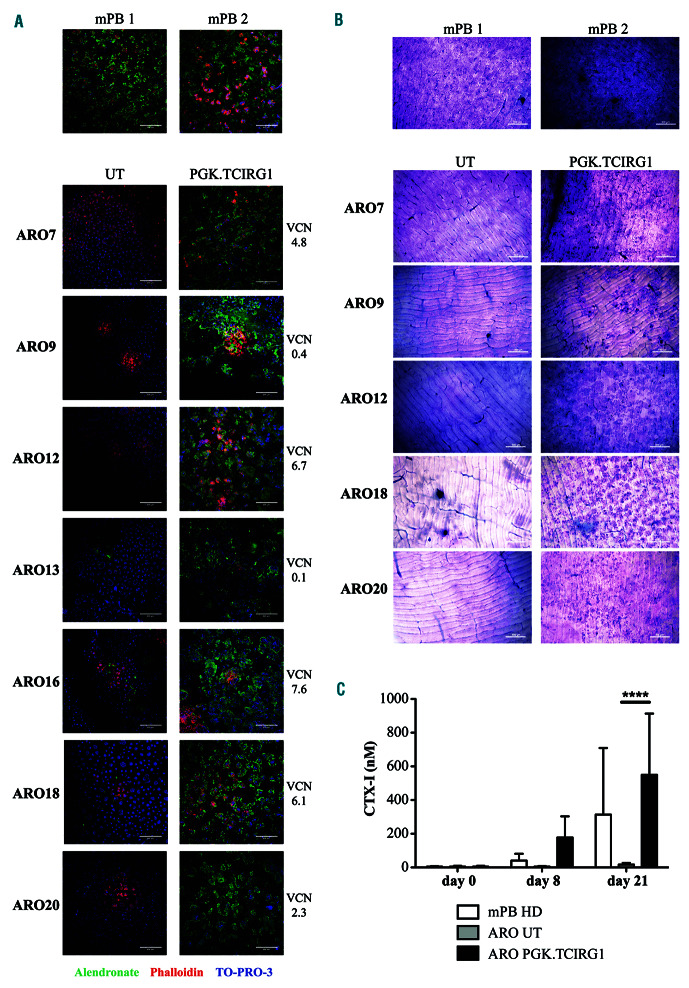
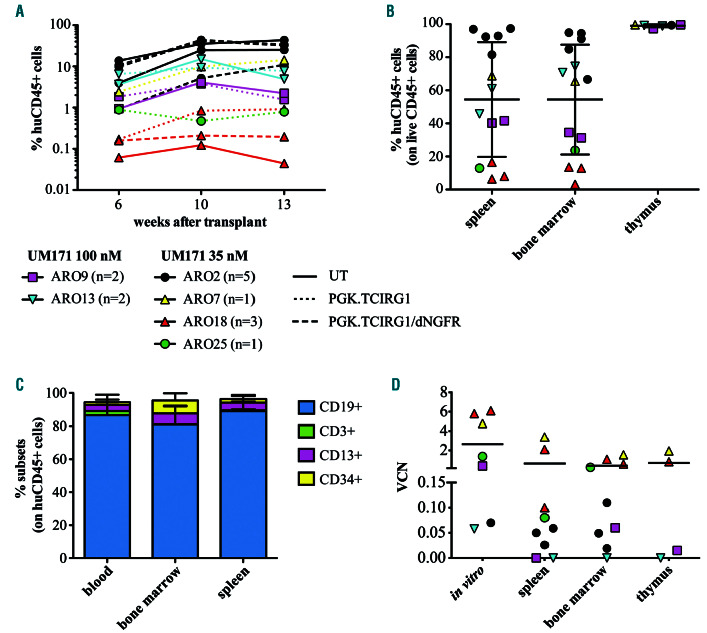
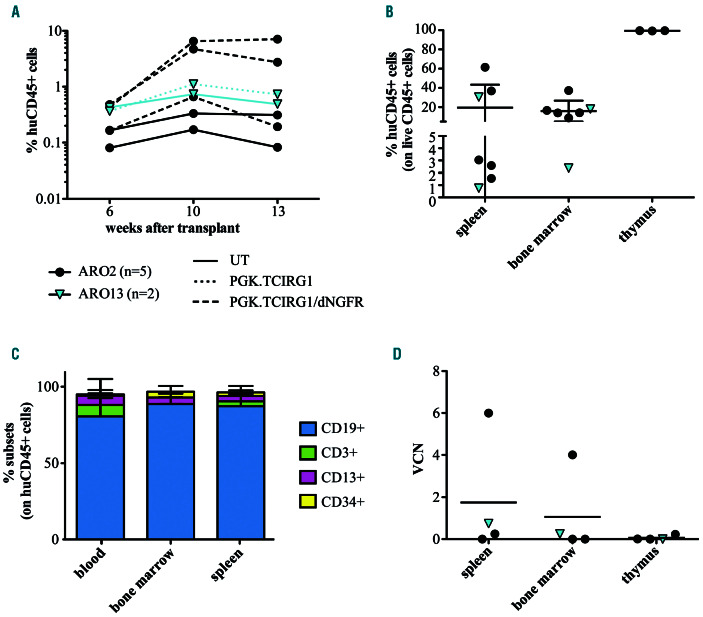
Allogeneic hematopoietic stem cell transplantation is the treatment of choice for autosomal recessive osteopetrosis caused by defects in the TCIRG1 gene. Despite recent progress in conditioning, a relevant number of patients are not eligible for allogeneic stem cell transplantation because of the severity of the disease and significant transplant-related morbidity. We exploited peripheral CD34+ cells, known to circulate at high frequency in the peripheral blood of TCIRG1-deficient patients, as a novel cell source for autologous transplantation of gene corrected cells. Detailed phenotypical analysis showed that circulating CD34+ cells have a cellular composition that resembles bone marrow, supporting their use in gene therapy protocols. Transcriptomic profile revealed enrichment in genes expressed by hematopoietic stem and progenitor cells (HSPCs). To overcome the limit of bone marrow harvest/ HSPC mobilization and serial blood drawings in TCIRG1 patients, we applied UM171-based ex-vivo expansion of HSPCs coupled with lentiviral gene transfer. Circulating CD34+ cells from TCIRG1-defective patients were transduced with a clinically-optimized lentiviral vector (LV) expressing TCIRG1 under the control of phosphoglycerate promoter and expanded ex vivo. Expanded cells maintained long-term engraftment capacity and multi-lineage repopulating potential when transplanted in vivo both in primary and secondary NSG recipients. Moreover, when CD34+ cells were differentiated in vitro, genetically corrected osteoclasts resorbed the bone efficiently. Overall, we provide evidence that expansion of circulating HSPCs coupled to gene therapy can overcome the limit of stem cell harvest in osteopetrotic patients, thus opening the way to future gene-based treatment of skeletal diseases caused by bone marrow fibrosis.
Figures
Similar articles
-
Hematopoietic Stem Cell-Targeted Neonatal Gene Therapy with a Clinically Applicable Lentiviral Vector Corrects Osteopetrosis in oc/oc Mice.Hum Gene Ther. 2019 Nov;30(11):1395-1404. doi: 10.1089/hum.2019.047. Epub 2019 Jul 3. Hum Gene Ther. 2019. PMID: 31179768
-
Lentiviral gene transfer of TCIRG1 into peripheral blood CD34(+) cells restores osteoclast function in infantile malignant osteopetrosis.Bone. 2013 Nov;57(1):1-9. doi: 10.1016/j.bone.2013.07.026. Epub 2013 Jul 29. Bone. 2013. PMID: 23907031
-
Targeting NSG Mice Engrafting Cells with a Clinically Applicable Lentiviral Vector Corrects Osteoclasts in Infantile Malignant Osteopetrosis.Hum Gene Ther. 2018 Aug;29(8):938-949. doi: 10.1089/hum.2017.053. Epub 2017 Oct 3. Hum Gene Ther. 2018. PMID: 28726516
-
The role of granulocyte colony-stimulating factor in mobilization and transplantation of peripheral blood progenitor and stem cells.Cytokines Mol Ther. 1995 Dec;1(4):249-70. Cytokines Mol Ther. 1995. PMID: 9384679 Review.
-
Sources of Hematopoietic Stem and Progenitor Cells and Methods to Optimize Yields for Clinical Cell Therapy.Biol Blood Marrow Transplant. 2017 Aug;23(8):1241-1249. doi: 10.1016/j.bbmt.2017.05.003. Epub 2017 May 8. Biol Blood Marrow Transplant. 2017. PMID: 28495640 Review.
Cited by
-
Molecular Mechanisms of Craniofacial and Dental Abnormalities in Osteopetrosis.Int J Mol Sci. 2023 Jun 20;24(12):10412. doi: 10.3390/ijms241210412. Int J Mol Sci. 2023. PMID: 37373559 Free PMC article. Review.
-
Recombinant Limb Assay as in Vivo Organoid Model.Front Cell Dev Biol. 2022 Apr 26;10:863140. doi: 10.3389/fcell.2022.863140. eCollection 2022. Front Cell Dev Biol. 2022. PMID: 35557939 Free PMC article.
-
Circulating hematopoietic stem/progenitor cell subsets contribute to human hematopoietic homeostasis.Blood. 2024 May 9;143(19):1937-1952. doi: 10.1182/blood.2023022666. Blood. 2024. PMID: 38446574 Free PMC article. Clinical Trial.
-
Correction of osteopetrosis in the neonate oc/oc murine model after lentiviral vector gene therapy and non-genotoxic conditioning.Front Endocrinol (Lausanne). 2024 Sep 9;15:1450349. doi: 10.3389/fendo.2024.1450349. eCollection 2024. Front Endocrinol (Lausanne). 2024. PMID: 39314524 Free PMC article.
-
Clinical and molecular characterization of five Chinese patients with autosomal recessive osteopetrosis.Mol Genet Genomic Med. 2021 Nov;9(11):e1815. doi: 10.1002/mgg3.1815. Epub 2021 Sep 21. Mol Genet Genomic Med. 2021. PMID: 34545712 Free PMC article.
References
-
- Teti A, Teitelbaum SL. Congenital disorders of bone and blood. Bone. 2019;11:971-81. - PubMed
-
- Sobacchi C, Schulz A, Coxon FP, Villa A, Helfrich MH. Osteopetrosis: genetics, treatment and new insights into osteoclast function. Nat Rev Endocrinol. 2013;9(9):522-536. - PubMed
-
- Palagano E, Menale C, Sobacchi C, Villa A. Genetics of osteopetrosis. Curr Osteoporos Rep. 2018;16(1):13-25. - PubMed
-
- Frattini A, Orchard PJ, Sobacchi C, et al. Defects in TCIRG1 subunit of the vacuolar proton pump are responsible for a subset of human autosomal recessive osteopetrosis. Nat Genet. 2000;25(3):343-346. - PubMed
-
- Wu CC, Econs MJ, DiMeglio LA, et al. Diagnosis and management of osteopetrosis: consensus guidelines from the osteopetrosis working group. J Clin Endocrinol Metab. 2017;102(9):3111-3123. - PubMed
Publication types
MeSH terms
Substances
Grants and funding
LinkOut - more resources
Full Text Sources
Molecular Biology Databases
