Endothelial-specific deficiency of megalin in the brain protects mice against high-fat diet challenge
- PMID: 31937343
- PMCID: PMC6961312
- DOI: 10.1186/s12974-020-1702-2
Endothelial-specific deficiency of megalin in the brain protects mice against high-fat diet challenge
Abstract
Background: The increasing risk of obesity and diabetes among other metabolic disorders are the consequence of shifts in dietary patterns with high caloric-content food intake. We previously reported that megalin regulates energy homeostasis using blood-brain barrier (BBB) endothelial megalin-deficient (EMD) mice, since these animals developed obesity and metabolic syndrome upon normal chow diet administration. Obesity in mid-life appears to be related to greater dementia risk and represents an increasing global health issue. We demonstrated that EMD phenotype induced impaired learning ability and recognition memory, neurodegeneration, neuroinflammation, reduced neurogenesis, and mitochondrial deregulation associated with higher mitochondrial mass in cortical tissues.
Methods: EMD mice were subjected to normal chow and high-fat diet (HFD) for 14 weeks and metabolic changes were evaluated.
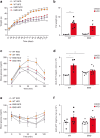
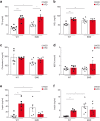
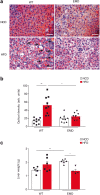
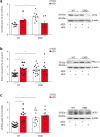
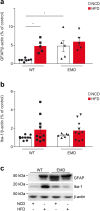
Results: Surprisingly, BBB megalin deficiency protected against HFD-induced obesity improving glucose tolerance and preventing hepatic steatosis. Compared to wild type (wt), the brain cortex in EMD mice showed increased levels of the mitochondrial biogenesis regulator, peroxisome proliferator-activated receptor γ coactivator-1α (PGC-1α), and uncoupling protein 2 (UCP2), a thermogenic protein involved in the regulation of energy metabolism. This agreed with the previously found increased mitochondrial mass in the transgenic mice. Upon HFD challenge, we demonstrated these two proteins were found elevated in wt mice but reported no changes over the already increased levels in EMD animals.
Conclusion: We propose a protective role for megalin on diet-induce obesity, suggesting this could be related to metabolic disturbances found in dementia through brain endocrine system communications.
Keywords: High-fat diet; Leptin; Megalin; Mitochondrial biogenesis; Obesity.
Conflict of interest statement
The authors declare that they have no competing interests.
Figures
Similar articles
-
Obesity and neuroinflammatory phenotype in mice lacking endothelial megalin.J Neuroinflammation. 2017 Jan 31;14(1):26. doi: 10.1186/s12974-017-0800-2. J Neuroinflammation. 2017. PMID: 28143489 Free PMC article.
-
Autophagy activation, not peroxisome proliferator-activated receptor γ coactivator 1α, may mediate exercise-induced improvements in glucose handling during diet-induced obesity.Exp Physiol. 2017 Sep 1;102(9):1194-1207. doi: 10.1113/EP086406. Epub 2017 Jul 22. Exp Physiol. 2017. PMID: 28639297
-
Aryl hydrocarbon receptor deficiency protects mice from diet-induced adiposity and metabolic disorders through increased energy expenditure.Int J Obes (Lond). 2015 Aug;39(8):1300-1309. doi: 10.1038/ijo.2015.63. Epub 2015 Apr 24. Int J Obes (Lond). 2015. PMID: 25907315 Free PMC article.
-
The interactions between energy homeostasis and neurovascular plasticity.Nat Rev Endocrinol. 2024 Dec;20(12):749-759. doi: 10.1038/s41574-024-01021-8. Epub 2024 Jul 25. Nat Rev Endocrinol. 2024. PMID: 39054359 Review.
-
Obesity-Induced Brain Neuroinflammatory and Mitochondrial Changes.Metabolites. 2023 Jan 5;13(1):86. doi: 10.3390/metabo13010086. Metabolites. 2023. PMID: 36677011 Free PMC article. Review.
Cited by
-
Inflammatory Responses of Astrocytes Are Independent from Lipocalin 2.J Mol Neurosci. 2021 May;71(5):933-942. doi: 10.1007/s12031-020-01712-7. Epub 2020 Sep 21. J Mol Neurosci. 2021. PMID: 32959226
-
Iron Metabolism in Obesity and Metabolic Syndrome.Int J Mol Sci. 2020 Aug 1;21(15):5529. doi: 10.3390/ijms21155529. Int J Mol Sci. 2020. PMID: 32752277 Free PMC article. Review.
-
Is LRP2 Involved in Leptin Transport over the Blood-Brain Barrier and Development of Obesity?Int J Mol Sci. 2021 May 8;22(9):4998. doi: 10.3390/ijms22094998. Int J Mol Sci. 2021. PMID: 34066779 Free PMC article.
-
Obesogenic Diet-Induced Neuroinflammation: A Pathological Link between Hedonic and Homeostatic Control of Food Intake.Int J Mol Sci. 2023 Jan 11;24(2):1468. doi: 10.3390/ijms24021468. Int J Mol Sci. 2023. PMID: 36674982 Free PMC article. Review.
-
Increase of α-dicarbonyls in liver and receptor for advanced glycation end products on immune cells are linked to nonalcoholic fatty liver disease and liver cancer.Oncoimmunology. 2021 Feb 8;10(1):1874159. doi: 10.1080/2162402X.2021.1874159. Oncoimmunology. 2021. PMID: 33628620 Free PMC article.
References
MeSH terms
Substances
Grants and funding
LinkOut - more resources
Full Text Sources
Molecular Biology Databases

