

Splicing Players Are Differently Expressed in Sporadic Amyotrophic Lateral Sclerosis Molecular Clusters and Brain Regions
- PMID: 31936368
- PMCID: PMC7017305
- DOI: 10.3390/cells9010159
Splicing Players Are Differently Expressed in Sporadic Amyotrophic Lateral Sclerosis Molecular Clusters and Brain Regions
Abstract
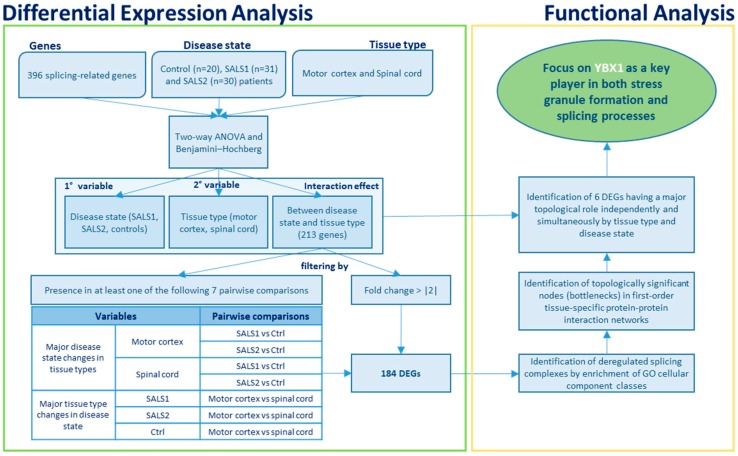
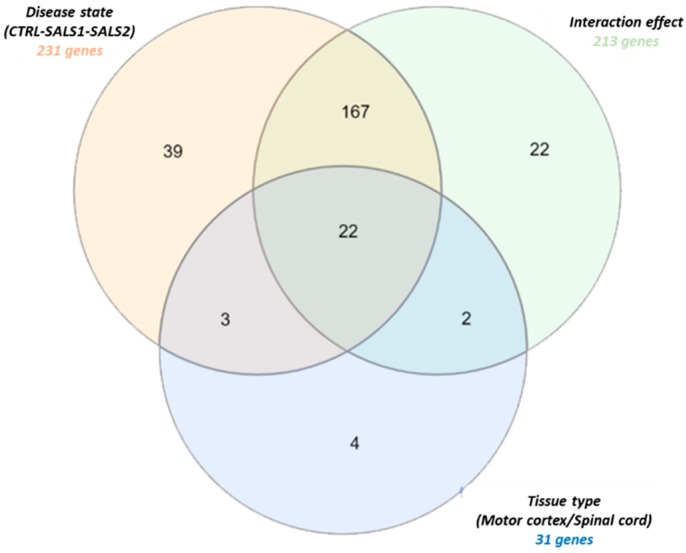
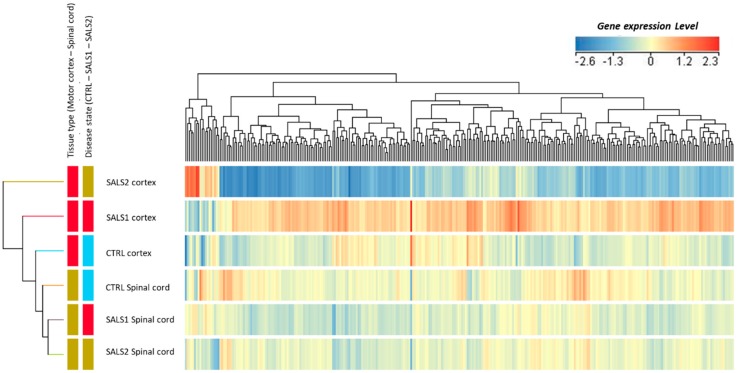
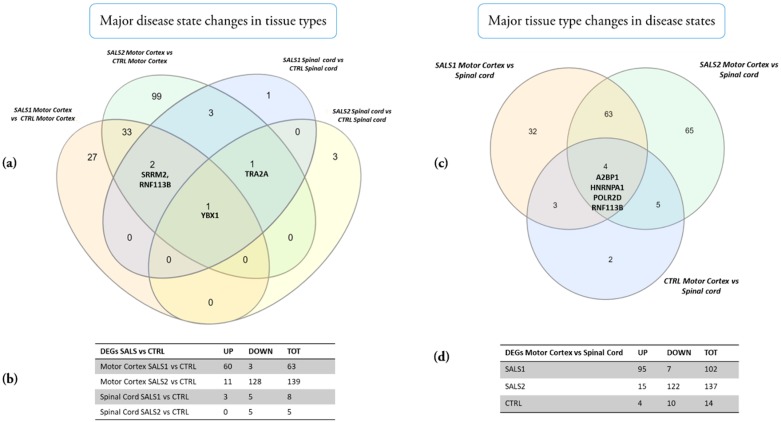
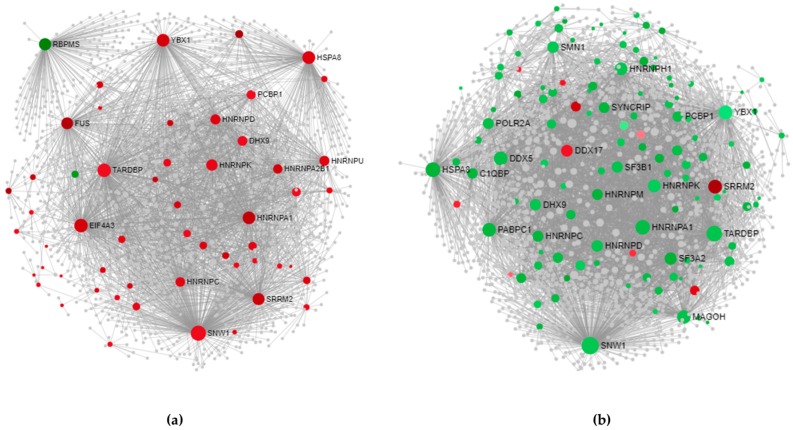
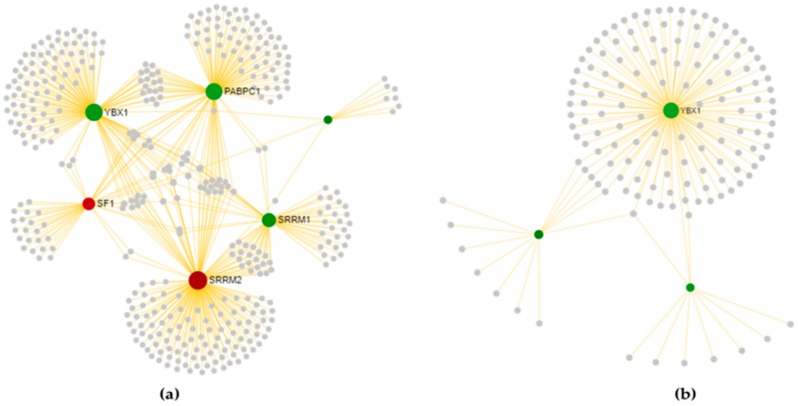
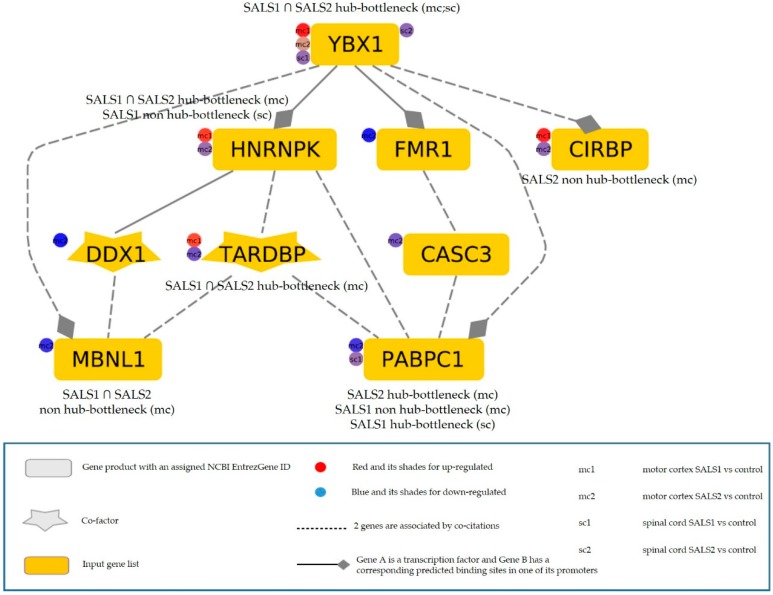
Splicing is a tightly orchestrated process by which the brain produces protein diversity over time and space. While this process specializes and diversifies neurons, its deregulation may be responsible for their selective degeneration. In amyotrophic lateral sclerosis (ALS), splicing defects have been investigated at the singular gene level without considering the higher-order level, involving the entire splicing machinery. In this study, we analyzed the complete spectrum (396) of genes encoding splicing factors in the motor cortex (41) and spinal cord (40) samples from control and sporadic ALS (SALS) patients. A substantial number of genes (184) displayed significant expression changes in tissue types or disease states, were implicated in distinct splicing complexes and showed different topological hierarchical roles based on protein-protein interactions. The deregulation of one of these splicing factors has a central topological role, i.e., the transcription factor YBX1, which might also have an impact on stress granule formation, a pathological marker associated with ALS.
Keywords: SALS molecular subtypes; YBX1; amyotrophic lateral sclerosis; hub-bottlenecks; motor cortex; non hub-bottlenecks; spinal cord; spliceosome; splicing factors; tissue-specific program.
Conflict of interest statement
The authors declare no conflict of interest.
Figures
Similar articles
-
Tissue-selective regulation of protein homeostasis and unfolded protein response signalling in sporadic ALS.J Cell Mol Med. 2020 Jun;24(11):6055-6069. doi: 10.1111/jcmm.15170. Epub 2020 Apr 23. J Cell Mol Med. 2020. PMID: 32324341 Free PMC article.
-
Splicing factor proline and glutamine rich intron retention, reduced expression and aggregate formation are pathological features of amyotrophic lateral sclerosis.Neuropathol Appl Neurobiol. 2021 Dec;47(7):990-1003. doi: 10.1111/nan.12749. Epub 2021 Aug 2. Neuropathol Appl Neurobiol. 2021. PMID: 34288034
-
Immunoreactivity of valosin-containing protein in sporadic amyotrophic lateral sclerosis and in a case of its novel mutant.Acta Neuropathol Commun. 2014 Dec 10;2:172. doi: 10.1186/s40478-014-0172-0. Acta Neuropathol Commun. 2014. PMID: 25492614 Free PMC article.
-
The molecular link between inefficient GluA2 Q/R site-RNA editing and TDP-43 pathology in motor neurons of sporadic amyotrophic lateral sclerosis patients.Brain Res. 2014 Oct 10;1584:28-38. doi: 10.1016/j.brainres.2013.12.011. Epub 2013 Dec 16. Brain Res. 2014. PMID: 24355598 Review.
-
Alternative Splicing of ALS Genes: Misregulation and Potential Therapies.Cell Mol Neurobiol. 2020 Jan;40(1):1-14. doi: 10.1007/s10571-019-00717-0. Epub 2019 Aug 5. Cell Mol Neurobiol. 2020. PMID: 31385134 Review.
Cited by
-
Network Analysis of the CSF Proteome Characterizes Convergent Pathways of Cellular Dysfunction in ALS.Front Neurosci. 2021 Mar 17;15:642324. doi: 10.3389/fnins.2021.642324. eCollection 2021. Front Neurosci. 2021. PMID: 33815045 Free PMC article.
-
Alternative Splicing: Recent Insights into Mechanisms and Functional Roles.Cells. 2020 Oct 20;9(10):2327. doi: 10.3390/cells9102327. Cells. 2020. PMID: 33092102 Free PMC article.
-
De novo truncating NOVA2 variants affect alternative splicing and lead to heterogeneous neurodevelopmental phenotypes.Hum Mutat. 2022 Sep;43(9):1299-1313. doi: 10.1002/humu.24414. Epub 2022 Jun 8. Hum Mutat. 2022. PMID: 35607920 Free PMC article.
-
A Diagnostic Gene-Expression Signature in Fibroblasts of Amyotrophic Lateral Sclerosis.Cells. 2023 Jul 18;12(14):1884. doi: 10.3390/cells12141884. Cells. 2023. PMID: 37508548 Free PMC article.
-
CXCR2 Is Deregulated in ALS Spinal Cord and Its Activation Triggers Apoptosis in Motor Neuron-Like Cells Overexpressing hSOD1-G93A.Cells. 2023 Jul 9;12(14):1813. doi: 10.3390/cells12141813. Cells. 2023. PMID: 37508478 Free PMC article.
References
Publication types
MeSH terms
Substances
LinkOut - more resources
Full Text Sources
Medical
Miscellaneous
