. 2020 Mar;32(3):683-702.
doi: 10.1105/tpc.19.00521. Epub 2020 Jan 9.

Kinesin-13 and Kinesin-8 Function during Cell Growth and Division in the Moss Physcomitrella patens

Affiliations

Kinesin-13 and Kinesin-8 Function during Cell Growth and Division in the Moss Physcomitrella patens

Shu Yao Leong et al. Plant Cell. 2020 Mar.

Abstract

Kinesin-13 and Kinesin-8 are well-known microtubule (MT) depolymerases that regulate MT length and chromosome movement in animal mitosis. While much is unknown about plant Kinesin-8, Arabidopsis (Arabidopsis thaliana) and rice (Oryza sativa) Kinesin-13 have been shown to depolymerize MTs in vitro. However, the mitotic function of both kinesins has yet to be determined in plants. Here, we generated complete null mutants of Kinesin-13 and Kinesin-8 in moss (Physcomitrella patens). Both kinesins were found to be nonessential for viability, but the Kinesin-13 knockout (KO) line had increased mitotic duration and reduced spindle length, whereas the Kinesin-8 KO line did not display obvious mitotic defects. Surprisingly, spindle MT poleward flux, which is mediated by Kinesin-13 in animals, was retained in the absence of Kinesin-13. MT depolymerase activity was not detectable for either kinesin in vitro, while MT catastrophe-inducing activity (Kinesin-13) or MT gliding activity (Kinesin-8) was observed. Interestingly, both KO lines showed waviness in their protonema filaments, which correlated with positional instability of the MT foci in their tip cells. Taken together, the results suggest that plant Kinesin-13 and Kinesin-8 have diverged in both mitotic function and molecular activity, acquiring roles in regulating MT foci positioning for directed tip growth.


Figures

Figure 1.
Figure 1.
Conservation of Kinesin-13 and Kinesin-8 in the Moss P. patens. (A) Protein domains of Kinesin-13 (represented with Kinesin-13b) and Kinesin-8 (represented with Kinesin-8II) of moss, compared with D. melanogaster KLP10A/Kinesin-13 and S. cerevisiae Kip3/Kinesin-8. Domains of Drosophila and budding yeast proteins were obtained from UniProt, whereas moss protein domains were predicted using InterPro. (B) Kinesin-13 and Kinesin-8 phylogeny across the moss P. patens, the Brassica Arabidopsis, the liverwort Marchantia polymorpha, the rice O. sativa subsp japonica, the fruitfly D. melanogaster, mammalians Mus muculus and H. sapiens, and also for Kinesin-8 in the budding yeast S. cerevisiae and fission yeast Schizosaccharomyces pombe. After amino acid sequences were aligned with MAFFT, gapped regions were removed manually using MacClade. The phylogenetic tree was constructed using neighbor-joining methods using MEGA software. Reliability was assessed with 1000 bootstrapping trials. Protein sequences are presented in Supplemental Data Set 1. Horizontal branch length is proportional to the estimated evolutionary distance. Bar = 0.1 amino acid substitution per site.
Figure 2.
Figure 2.
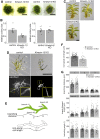
Kinesin-13 and Kinesin-8 KO Mosses Are Morphologically Normal, but Kinesin-13 KO Moss Shows Retarded Growth and Reduced Cell Length. (A) and (B) Colony size comparison between control (GFP-tubulin/histoneH2B-mRFP) and Kinesin-13 KO (GPH0438#30, left) or Kinesin-8 KO (GPH0433#9, right) moss. Colonies were cultured from single protoplasts for 27 to 28 d on BCDAT. At least two independent experiments each with at least two plates of colonies were performed. The average colony area for each line on each plate was obtained. Actual areas were then divided by the average area of the control sample to get relative colony size. In the Kinesin-13 KO experiment, KO moss had a relative size of 0.55 ± 0.04 (mean ± se; n = 7), whereas control moss had a relative size of 1.00 ± 0.12 (mean ± se; n = 6). In the Kinesin-8 KO experiment, KO moss had a relative size of 1.01 ± 0.05 (mean ± se; n = 8), whereas control moss had a relative size of 1.00 ± 0.08 (mean ± se; n = 8). Points represent individual colonies; results are from one of at least two independent experiments. Bar = 5 mm. (C) Gametophore and rhizoids of control moss (GFP-tubulin/histoneH2B-mRFP) and Kinesin-13 KO (GPH0438#6) or Kinesin-8 KO (GPH0433#7) moss. Gametophores were isolated from colonies from small colony subcultures cultured on BCDAT for 27 to 28 d. Bar = 1 mm. (D) Day-8 moss colonies cultured from protoplast of control (GFP-tubulin/histoneH2B-mRFP) and Kinesin-13 KO (GPH0438#30) under bright-field light (top) and with calcofluor staining (bottom). Yellow dashed boxes, inset region. Bars = 500 µm; inset bar = 50 µm. (E) Cartoon depicting the measurements taken for nonapical cell length in (F) and branching phenotype analysis in (G). (F) Nonapical cell lengths of caulonema filaments were measured using calcofluor-stained colonies as in (D, bottom) for control (GFP-tubulin/histoneH2B-mRFP) and Kinesin-13 KO (GPH0438#30). Nonapical cell length was reduced in Kinesin-13 KO moss to 79.9 ± 5.5 µm (mean ± se; n = 43), compared with control moss of 113.7 ± 1.9 µm (mean ± se; n = 132). Points represent individual cells; results are pooled from two independent experiments where two independent lines were analyzed. (G) Branching phenotype analysis of control (GFP-tubulin/histoneH2B-mRFP) and Kinesin-13 KO (GPH0438#30). In particular, branching distance of the first branch site to cell tip (top graph, leftmost bars) was increased in Kinesin-13 KO moss to 338.4 ± 12.9 µm (mean ± se; n = 55), compared with control moss of 293.1 ± 8.8 µm (mean ± se; n = 71). Points represent individual filaments; results are pooled from two independent experiments where two independent lines were analyzed.
Figure 3.
Figure 3.
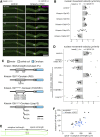
Kinesin-13abc Triple KO Shows Retrograde Nuclear Movement, While Kinesin-13ac Double KO Shows Both Retrograde and Anterograde Nuclear Movement as Cells Enter Mitosis. (A) Snapshots of control (GFP-tubulin/histoneH2B-mRFP) and Kinesin-13 KO (GPH0438#30) moss during prophase nuclear/spindle movement. Kinesin-13 KO moss shows retrograde nuclear/spindle movement. Apical side, right, positive value for analysis in (B) and (D); basal side, left, negative values for analysis in (B) and (D); yellow dotted line, nucleus position at NEBD. NEBD, 0 min. Bar = 50 µm. (B) Nuclear movement velocity during prophase of control (GFP-tubulin/histoneH2B-mRFP; 0.68 ± 0.10 µm/min, mean ± se; n = 8), Kinesin-13a single KO (GPH0411#43; 0.85 ± 0.10 µm/min, mean ± se; n = 8), Kinesin-13b single KO (GPH0412#11; 0.43 ± 0.03 µm/min, mean ± se; n = 7), Kinesin-13ab double KO (GPH0419#33; 0.62 ± 0.04 µm/min, mean ± se; n = 11), Kinesin-13ac double KO (GPH0420#125; –0.03 ± 0.13 µm/min, mean ± se; n = 16), and Kinesin-13abc triple KO (GPH0438#30; –0.69 ± 0.08 µm/min, mean ± se; n = 11). Kinesin-13abc triple KO shows a clear retrograde nuclear movement, whereas Kinesin-13ac double KO shows intermediate retrograde nuclear movement. Apically directed/anterograde movement, positive values; basally directed/retrograde movement, negative values. Points represent individual mitotic events. Results are from one of three independent experiments where two independent lines were analyzed. (C) Protein domains of Kinesin-13b and mutant proteins for rescue experiments. Point mutations on Kinesin-13b-Cerulean, which was introduced under the EF1α promoter at the PTA1 site in the moss used for rescue experiments are illustrated. a.a., amino acids. (D) Nuclear movement velocity during prophase of control (GFP-tubulin/histoneH2B-mRFP; 0.94 ± 0.10 µm/min, mean ± se; n = 17), Kinesin-13abc triple KO (GPH0438#30; –1.43 ± 0.22 µm/min, mean ± se; n = 29), Cerulean/Kinesin-13abc triple KO (GPH0903#1; –0.99 ± 0.25 µm/min, mean ± se; n = 16), Kinesin-13b(FL)-Cerulean/Kinesin-13abc triple KO (GPH0899#10; 1.04 ± 0.09 µm/min, mean ± se; n = 13), Kinesin-13bRIG-Cerulean/Kinesin-13abc triple KO (GPH0902#2; –0.58 ± 0.20 µm/min, mean ± se; n = 17), Kinesin-13bKVD/KEC-Cerulean/Kinesin-13abc triple KO (GPH0900#4; –0.94 ± 0.08 µm/min, mean ± se; n = 10), and Kinesin-13bLoop2-Cerulean/Kinesin-13abc triple KO (GPH0901#1; –1.05 ± 0.20 µm/min, mean ± se; n = 27). Apically directed movement, positive values; basally directed movement, negative values. Points represent individual mitotic events. Results are from one of two independent experiments where at least two independent lines were analyzed. (E) Cartoon depicting how subapical and apical cell lengths were measured for (F). (F) Subapical cell length was reduced in the Kinesin-13 KO line (GPH0438#30; 70.9 ± 3.6 µm [mean ± se; n = 26; P-value < 0.05, Welch’s two-sample t test]) compared with the control (GFP-tubulin/histoneH2B-mRFP; 105.2 ± 12.4 µm [mean ± se; n = 11]). Each point represents individual mitotic events. Results shown are from one of two independent experiments where two independent lines were analyzed.
Figure 4.
Figure 4.
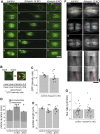
Kinesin-13 KO Moss Shows Defects in Nuclear-Proximal MT Array, Mitotic Duration, and Spindle Length, but Shows No Difference in Spindle Flux Rate. (A) Mitosis of control (GFP-tubulin/histoneH2B-mRFP), Kinesin-13 KO (GPH0438#6), and Kinesin-8 KO (GPH0433#9) moss. Kinesin-13 KO showed reduced metaphase spindle length, retrograde nuclear movement during prophase, increased mitotic duration, and loss of apical bias of nuclear MTs. Kinesin-8 KO did not show mitotic defects. NEBD, 0 min; left, basal side; right, apical side. Bar = 10 μm. (B) and (C) Apical:basal GFP-intensity ratio of GFP-tubulin around the nucleus 1 min before NEBD was measured as the ratio of GFP-tubulin intensities between apical and basal hemispheric circumference. In (C), control (GFP-tubulin/histoneH2B-mRFP), 1.17 ± 0.04 (mean ± se; n = 9; P-value < 0.05, Welch’s two sample t test); Kinesin-13 KO (GPH0438#6, 30), 1.00 ± 0.07 (mean ± se; n = 10). Points represent individual mitotic events. (D) Mitotic duration of control (GFP-tubulin/histoneH2B-mRFP), Kinesin-13 KO (GPH0438#6, 30), and Kinesin-8 KO (GPH0433#7, 9) moss as measured from NEBD to anaphase onset. Control, 9.8 ± 0.3 min (mean ± se; n = 11); Kinesin-13 KO, 11.8 ± 0.4 min (mean ± se, n = 15; P-value < 0.001, Welch’s two sample t test); Kinesin-8 KO, 9.1 ± 0.2 min (mean ± se; n = 10; P-value < 0.05, Welch’s two sample t test). The duration of prometaphase (from NEBD to chromosome alignment) and metaphase (chromosome alignment to anaphase onset) was also measured and shown. Data shown were pooled from two independent experiments. (E) Spindle length was measured at metaphase (defined as 1 min before anaphase onset) by obtaining the distance between midpoints of apical and basal spindle widths. Control (GFP-tubulin/histoneH2B-mRFP), 13.0 ± 0.3 µm (mean ± se; n = 4); Kinesin-13 KO (GPH0438#30), 11.2 ± 0.3 µm (mean ± se; n = 10; P-value < 0.01, Welch’s two-sample t test); Kinesin-8 KO (GPH0433#9), 12.3 ± 0.5 µm (mean ± se; n = 10). Points represent individual mitotic events. (F) Spindle poleward flux of control (GFP-tubulin/histoneH2B-mRFP) and Kinesin-13 KO (GPH0438#30) moss was examined in photobleaching experiments where GFP-tubulin signals on a strip along the metaphase plate was bleached. The bleached regions separating toward the poles are indicative of spindle poleward flux function. Yellow dashed rectangle in the top panel indicates region used to make time series (bottom panel); cyan dashed rectangle represents bleached region; red lines indicate the segmented lines drawn on the kymograph to obtain the flux rate in (G). Horizontal bar = 5 μm; vertical bar = 12 s. (G) Quantification of spindle poleward flux experiment as shown in (F). Control, 2.1 ± 0.2 µm/min (mean ± se; n = 22); Kinesin-13 KO, 2.2 ± 0.4 µm/min (mean ± se; n = 19). Points represent individual mitotic events, shown are results from four independent experiments.
Figure 5.
Figure 5.
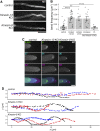
Kinesin-13 and Kinesin-8 KO Moss Have Wavy Protonema Filaments Associated with Unstable MT Foci Positioning. (A) Protonema filaments of control (GFP-tubulin/histoneH2B-mRFP), Kinesin-13 KO (GPH0438#30), and Kinesin-8 KO (GPH0433#9) moss. Bar = 50 µm. (B) Waviness of protonema filaments measured as frequency of wavy bend (18° < angle < 90°) of protonema filaments over measured lengths. Control (GFP-tubulin/histoneH2B-mRFP), 0.006 ± 0.001 μm−1 (mean ± se; n = 28 filaments); Kinesin-13 KO (GPH0438#30), 0.024 ± 0.002 µm−1 (mean ± se; n = 26 filaments; P-value < 0.0001); Kinesin-8 KO (GPH0433#7), 0.022 ± 0.005 µm−1 (mean ± se; n = 8 filaments; P-value < 0.01); Cerulean/Kinesin-13 KO (GPH0903#1), 0.022 ± 0.004 µm−1 (mean ± se; n = 12); Kinesin-13b(full-length)-Cerulean/Kinesin-13 KO (GPH0899#10), 0.004 ± 0.001 µm−1 (mean ± se; n = 8; P-value < 0.0001). Points represent individual protonema filaments, and results shown are from one experiment of at least four independent experiments. Tukey’s multiple comparison test was used for statistics (Supplemental Data Set 3). (C) MT foci at the tip of the caulonema cell of the control (GFP-tubulin/histoneH2B-mRFP), Kinesin-13 KO (GPH0438#30), and Kinesin-8 KO (GPH0433#9) moss. Images were acquired with z-sections at 0.3-µm intervals over a 20-µm range, and maximum z-projections are displayed. Bottom panels show overlaid time series. Colors in time series indicate different time points as labeled in top panels. Bar = 10 μm. (D) MT foci positions were tracked using the FIJI MOSAIC plug-in 2D/3D particle tracker (Sbalzarini and Koumoutsakos, 2005) in time-lapse imaging data as in (C). (x, y) trajectories of three representative MT foci (shown in different colors) for each line are displayed. Each point represents subsequent positions at each time point, at 3-min intervals for 3 h. Same lines as in (B) are represented.
Figure 6.
Figure 6.
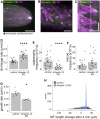
Kinesin-13 Localizes to the Interphase MT Network and Depletion of Kinesin-13 Results in Increased Shrinkage Rate, Reduced Catastrophe Frequency, Increased Rescue Frequency, and Reduced Growth Rate. (A) MT foci of Kinesin-13c-Citrine/mCherry-tubulin (GPH0100#15) moss. Images were acquired at 0.3-µm intervals over a 10-µm range; shown is maximum z-projection. Bar = 5 µm. (B) Interphase MT network of Kinesin-13c-Citrine/mCherry-tubulin (GPH0100#15) moss. Images were acquired by oblique illumination fluorescence split-view microscopy to avoid chloroplast autofluorescence. Bar = 2 µm. (C) Kymograph of MT growth taken from imaging as in (B), taken every 3 s. Vertical bar = 2 min; horizontal bar = 5 µm. (D) Interphase MT plus end shrinkage rate of control (GFP-tubulin/histoneH2B-mRFP, 0.245 ± 0.012 µm/s [mean ± se; n = 25 cells]) and Kinesin-13 KO (GPH0438#30, 0.429 ± 0.021 µm/s [mean ± se; n = 25 cells; P-value < 0.0001, Welch’s two-sample t test]) moss. Points represent individual cells; results shown are from one experiment of two independent experiments. (E) Interphase MT catastrophe frequency of control (GFP-tubulin/histoneH2B-mRFP, 9.3 ± 1.2 × 10⁻³/s [mean ± se; n = 33 cells]) and Kinesin-13 KO (GPH0438#30, 2.2 ± 0.5 × 10⁻³/s [mean ± se; n = 28 cells; P-value < 0.0001, Welch’s two-sample t test]). Points represent individual cells; results shown are from two independent experiments. (F) Interphase MT rescue frequency of control (GFP-tubulin/histoneH2B-mRFP, 14 ± 3 × 10⁻³/s [mean ± se; n = 25 cells]) and Kinesin-13 KO (GPH0438#30, 25 ± 6 × 10⁻³/s [mean ± se; n = 23 cells]). Points represent individual cells; results shown are from two independent experiments. (G) Interphase MT plus end growth rate of control (EB1-Citrine/mCherry-tubulin, GPH0379#2, 0.147 ± 0.013 µm/s [mean ± se; n = 5 cells, 50 MTs]) and Kinesin-13 KO moss (GPH0577#11, 0.093 ± 0.003 µm/s [mean ± se; n = 5 cells, 50 MTs; P-value < 0.05, Welch’s two-sample t test]). Points represent individual cells. (H) Simulation of MT growth of 4000 MTs in 4 min based on a probability model established using MT dynamics parameters from in vivo interphase MT dynamics analyses (D) to (G) (see Methods and Table 1). Control MT dynamics parameters yielded approximately normal distributions of MT lengths and tended to have a larger population of MTs with longer lengths, with the longest 25% of MTs ranging between 23.4 to 59.8 µm in length. For MTs under Kinesin-13 KO conditions, the distribution of MT length was narrower, with 50% of all MTs being from 11.5 to 22.6 µm in length, whereas the longest 25% of MTs ranged from 22.6 to 29.4 µm in length. Histogram bin width = 0.5 µm.
Figure 7.
Figure 7.
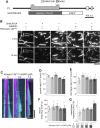
Recombinant Kinesin-13 Does Not Depolymerize Stabilized GMPCPP-MT Seeds but Shows MT Catastrophe-Inducing Activity. (A) Protein domains of the Kinesin-13b (FL) and recombinant Kinesin-13bmotor-mGFP (recombinant) construct. Protein domains were determined using InterPro. His-tag for affinity purification was attached to the C terminus of the recombinant protein. a.a., amino acids. (B) In vitro MT depolymerization assay using GMPCPP-stabilized MT seeds was performed using purified DmKLP10A, recombinant Kinesin-13bmotor-mGFP construct, AtMIDD1, AtMIDD1 and Kinesin-13bmotor-mGFP construct, and also under buffer only conditions. Only DmKLP10A successfully depolymerized MT seeds. The slight reduction in intensity in the bottom panels is due to photobleaching during imaging. All proteins were used at 200 nM except for AtMIDD1, which was at 100 nM. Bar = 5 µm. (C) Representative kymographs of in vitro MT dynamics polymerization assays with Kinesin-13bmotor-mGFP construct at 0, 0.3, and 1.5 µM. Time-lapse imaging was performed with TIRF microscopy taken every 3 s. Brightness and contrast were manually adjusted. Vertical bar = 2 min; horizontal bar = 5 µm. (D) to (G) In vitro MT dynamics parameters were analyzed from time-lapse imaging of in vitro MT dynamics polymerization assays with Kinesin-13bmotor-mGFP construct at 0, 0.15, 0.3, 0.6, and 1.5 µM taken using TIRF microscopy at 3-s intervals. In particular, growth rate (D) was observed to reduce slightly, from 9.0 ± 0.4 × 10⁻³µm/s (mean ± se; n = 3) in buffer only conditions, to 7.5 ± 0.7 × 10⁻³µm/s (mean ± se; n = 3) in 1.5 µM protein. Shrinkage rate and rescue frequency were shown in (E) and (F), respectively. Catastrophe frequency (G) was observed to reproducibly increase with high concentrations of Kinesin-13bmotor-mGFP, having a catastrophe frequency of 2.3 ± 0.2 × 10⁻³/s (mean ± se; n = 3) at 1.5 µM protein, compared to 1.2 ± 0.3 × 10⁻³/s in buffer only conditions. Points represent mean values from independent experiments, differently shaped points represent the different independent experiments.
Figure 8.
Figure 8.
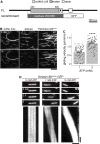
Recombinant Kinesin-8 Motor Does Not Depolymerize MTs but Shows MT Gliding Activity. (A) Protein domains of Kinesin-8II (FL) and recombinant Kinesin-8IImotor-GFP (recombinant) construct. Protein domains were identified using InterPro. His-tag for affinity purification was attached to the C terminus of the recombinant protein. a.a., amino acids. (B) In vitro MT depolymerization assay using GMPCPP-stabilized MT seeds was performed using purified ScKip3, recombinant Kinesin-8IImotor-GFP, and also under buffer only conditions. Only ScKip3 showed MT depolymerization activity. The slight reduction in intensity in the bottom panels is due to photobleaching during imaging. All proteins were used at 200 nM. Bar = 10 µm. (C) ATP-dependent MT gliding velocity of Kinesin-8IImotor-GFP. 1 mM ATP, 0.68 ± 0.03 µm/min (mean ± se; n = 124 MTs); 5 mM ATP, 1.18 ± 0.02 µm/min (mean ± se; n = 121 MTs, P-value < 0.0001, Welch’s two-sample t test). (D) In vitro MT gliding assay using GMPCPP-stabilized MTs on Kinesin-8IImotor-GFP, which was immobilized on glass, at 0, 1, and 5 mM ATP. Red dotted line in the top panel indicates the segmented line used to draw kymographs (bottom panels). Gliding activity of Kinesin-8IImotor-GFP was verified in three independent experiments. Vertical bar = 45 s; horizontal bar = 2 µm.
None

Similar articles

Cited by

References

    1. Collonnier C., Epert A., Mara K., Maclot F., Guyon-Debast A., Charlot F., White C., Schaefer D.G., Nogué F. (2017). CRISPR-Cas9-mediated efficient directed mutagenesis and RAD51-dependent and RAD51-independent gene targeting in the moss Physcomitrella patens. Plant Biotechnol. J. 15: 122–131. - PMC - PubMed
    1. Cove D. (2005). The moss Physcomitrella patens. Annu. Rev. Genet. 39: 339–358. - PubMed
    1. Dawson S.C., Sagolla M.S., Mancuso J.J., Woessner D.J., House S.A., Fritz-Laylin L., Cande W.Z. (2007). Kinesin-13 regulates flagellar, interphase, and mitotic microtubule dynamics in Giardia intestinalis. Eukaryotic Cell 6: 2354–2364. - PMC - PubMed
    1. Deng Z.Y., Liu L.T., Li T., Yan S., Kuang B.J., Huang S.J., Yan C.J., Wang T. (2015). OsKinesin-13A is an active microtubule depolymerase involved in glume length regulation via affecting cell elongation. Sci. Rep. 5: 9457. - PMC - PubMed
    1. Desai A., Verma S., Mitchison T.J., Walczak C.E. (1999). Kin I kinesins are microtubule-destabilizing enzymes. Cell 96: 69–78. - PubMed

Publication types

LinkOut - more resources