. 2020 Jan 8:9:e49998.
doi: 10.7554/eLife.49998.

Defining murine monocyte differentiation into colonic and ileal macrophages

Affiliations

Defining murine monocyte differentiation into colonic and ileal macrophages

Mor Gross-Vered et al. Elife. .

Abstract

Monocytes are circulating short-lived macrophage precursors that are recruited on demand from the blood to sites of inflammation and challenge. In steady state, classical monocytes give rise to vasculature-resident cells that patrol the luminal side of the endothelium. In addition, classical monocytes feed macrophage compartments of selected organs, including barrier tissues, such as the skin and intestine, as well as the heart. Monocyte differentiation under conditions of inflammation has been studied in considerable detail. In contrast, monocyte differentiation under non-inflammatory conditions remains less well understood. Here we took advantage of a combination of cell ablation and precursor engraftment to investigate the generation of gut macrophages from monocytes. Collectively, we identify factors associated with the gradual adaptation of monocytes to tissue residency. Moreover, comparison of monocyte differentiation into the colon and ileum-resident macrophages revealed the graduated acquisition of gut segment-specific gene expression signatures.

Keywords: colon; ileum; immunology; inflammation; intestine; macrophages; monocytes; mouse.


Conflict of interest statement

MG, ST, AS, BB, CC, GS, TS, ED, SB, LC, DL, SJ No competing interests declared

Figures
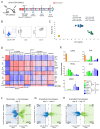
Figure 1.
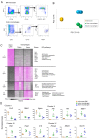
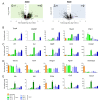
Figure 1.. Transcriptome analysis of CX3CR1+ monocyte graft - derived colonic and ileal macrophages isolated from macrophage depleted animals.
(A) Experimental protocol. Briefly, [CD11c-DTR > C57BL/6] BM chimeras were treated as indicated with DTx. 2 × 10⁶ CD117- CD11b+ CD115+ Ly6C+ GFPint BM monocytes isolated from Cx3cr1GFP/+ mice were injected intravenously. Macrophages were sorted from the colon and ileum at days 4, 8 and 12 post-transfer. Experiment was repeated three times, total 3–4 samples from each tissue at each time point. (B) Graft-derived macrophages were sorted at days 4, 8 and 12 post transfer based on CD45.1 and CX3CR1 (GFP) expression. GFP+ cells also express CD64, CD11b and variable levels of CD11c, and lacked Ly6C expression. (C) Principal component analysis (PCA) of transcriptomes of BM monocytes and grafted cells from colon and ileum at 4, 8 and 12 days post-transfer. Analysis performed in MATLAB. (D) Expression heat map of 4213 genes that show at least four fold change across all samples in the dataset, divided to seven clusters by the unbiased K-means algorithm in MATLAB. (Supplementary file 1, data sets 1,2, 5–11). (E) Representative genes from heat map in (D). (F–H) Double volcano plots of genes that change from monocytes to day 4, day 4 to day 8 and day 8 to day 12 in the colon (green dots) and ileum (blue dots). Blue and green squares indicate genes that are significantly (Student's T-test, p-value<0.05) changed between the different time points. Numbers within blue and green squares represent the number of genes in the square, namely genes that significantly change. Arrows indicate up –or down-regulation.
Figure 1—figure supplement 1.
Figure 1—figure supplement 1.. Comparison of gene expression in monocytes and resident colonic and ileal macrophages.
(A) Sorting schemes for BM Monocytes and resident intestinal macrophages isolated from CX3CR1-heterozygous CX3CR1GFP/+ C57BL/6 mice according to the following surface markers: CD117-CD11b+ CD115+ Ly6Chigh CX3CR1/GFPint (monocytes); DAPI- CD45+ CD11b+ CD64+ Ly6C-MHCII+ (macrophages). (B) Principal component analysis (PCA) of all 12346 genes expressed in BM monocytes and resident macrophages from the colon ad ileum of CX3CR1+/gfp mice. Analysis was performed in MATLAB. BM monocytes (n = 3); colon, ileum macrophages (n = 4, each) (Suppl. file 1, data sets 1, 2, 5).) (C) Heat map of transcriptomes and representative genes. 6200 genes that show at least two fold change across all samples in the dataset divided to four clusters by the K-means algorithm in MATLAB. Visualization performed in Gene-E. (Suppl. file 1, data sets 1, 2, 5). GO pathway analysis of clusters. (D) Example genes for the clusters in (C).
Figure 1—figure supplement 2.
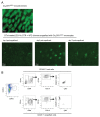
Figure 1—figure supplement 2.. Analysis of host tissue for graft-derived cells.
(A) Fluorescent images of ileum of CX3CR1GFP/+ mouse (top) and DTx-treated [CD11c-DTR > WT] BM chimeras engrafted with CX3CR1GFP/+ monocytes at the indicated days post-transfer. (B) Flow cytometric analysis of engrafted (CD45.1) and host (CD45.2) intestinal macrophages in the adoptive transfer model involving monocyte engraftment of DTx-treated [CD11c-DTR > WT] BM chimeras; representative analyzed sample is from day eight post engraftment.
Figure 1—figure supplement 3.
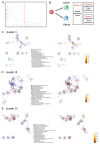
Figure 1—figure supplement 3.. Pathway analysis of graft-derived cells.
(A) Elbow plot to determine number of clusters. Since the plot was continuous, visual inspection was performed with different cluster numbers; according to cluster homogeneity we selected k = 7. (B) Schematic of clusters related to Figure 1D. (C) Metascape pathway analysis cluster II, genes shared by colonic and ileal monocyte graft-derived macrophages. (D) Metascape pathway analysis of cluster III, genes preferentially expressed by colonic monocyte graft-derived macrophages. (E) Metascape pathway analysis of cluster IV, genes preferentially expressed by ileal monocyte graft-derived macrophages.
Figure 1—figure supplement 4.
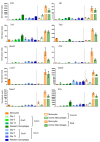
Figure 1—figure supplement 4.. Analysis of expression of pro-inflammatory genes in adoptive transfer model and DSS-induced colitis model.
Expression of genes in engrafted colonic and ileal macrophages, resident colonic and ileal macrophages at steady state, infiltrating monocytes and resident macrophages isolated from the colon of mice challenged with 1.5% DSS for 7 days and their respective controls.
Figure 2.
Figure 2.. Differences between acute monocyte graft -derived macrophages and resident intestinal macrophages.
(A) Volcano plots of genes that change from engrafted macrophages at day 12 and resident macrophages in the colon (left) and ileum (right). Gray dots represent genes that do not significantly change (p-value>0.05), black dots represent genes that significantly change (p-value<0.05). Green and blue squares mark genes with at least 2-fold log fold change (equals 4-fold read change). Numbers inside squares indicate number of genes in square, namely genes that significantly change. Arrows indicate up- or down-regulated genes in resident macrophages compared to engrafted macrophages at day 12 post transfer. (B) Example genes characterizing long-lived intestinal macrophages according to Shaw et al. (C) Example genes highly expressed in resident macrophages compared to engrafted cells. (D) Example genes highly expressed in engrafted cells compared to long-lived macrophages. (E) Example genes participating in IL10/IL10R axis.
Figure 2—figure supplement 1.
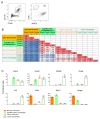
Figure 2—figure supplement 1.. Comparison of graft and engrafted cells to recent monocytic infiltrates in the colon, identified by their Ly6C surface expression.
(A) Representative flow cytometric analysis of colonic myeloid cells. Recent monocytic infiltrates and macrophages in the colon were defined as CD45+ CD11b+ Ly6C+ MHCII- and CD45+ CD11b+CD64+ Ly6C- MHCII+ cells, respectively and sorted accordingly for RNAseq. (B) Representative correlation coefficients between indicated cell populations (Suppl. file 1, data sets 3, 4, 5, 6). (C) Representative genes differentially expressed between monocyte graft, engrafted cells (d4), early monocyte infiltrates and resident macrophages.
Figure 2—figure supplement 2.
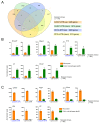
Figure 2—figure supplement 2.. Comparison of colonic macrophages generated upon monocyte transfer into [CD11c-DTR > WT] and [CX3CR1-DTR > WT] BM chimeras treated with DTx.
(A) Venn diagrams of gene lists up- and downregulated as compared to the monocyte graft. (B) Representative upregulated genes similarly expressed between the colonic macrophages as compared to the monocyte graft; engrafted cells isolated from [CD11c-DTR > WT] mice (d12); engrafted cells isolated from [CX3CR1-DTR > WT] mice (d14). (C) Representative downregulated genes similarly expressed between the colonic macrophages as compared to the monocyte graft; engrafted cells isolated from [CD11c-DTR > WT] mice (d12); engrafted cells isolated from [CX3CR1-DTR > WT] mice (d14).
Figure 3.
Figure 3.. Changes in gene expression during conversion of monocytes into colonic or ileal macrophages.
(A) Example genes that are significantly up-regulated in intestinal macrophages from monocytes to day 4: either up-regulated in the colon but do not change in the ileum, or significantly up-regulated in the ileum but do not change in the colon. Numbers indicate number of genes to follow the trend. Only genes which have significantly different levels between colonic and ileal macrophages at all time points (monocytes > day 4, day4 > day8, day8 > day12) were selected. (B) Example genes that are significantly down-regulated from monocytes to day four in intestinal macrophages: either down-regulated in the colon but do not change in the ileum, or significantly down-regulated in the ileum but do not change in the colon. Numbers indicate number of genes to follow the trend. (C) Example genes that are either up-regulated in the colon from monocytes to day four and down-regulated in the ileum from monocytes to day four or vice versa.
Figure 4.
Figure 4.. Changes in gene expression during conversion of monocytes into generic intestinal macrophages.
(A) Dot plot for genes whose expression changes at least 2-fold between both monocytes to engrafted colonic macrophages at day four and monocytes to engrafted ileal macrophages at day 4. Black dots: genes that significantly change in the transition to both tissues. Blue dots: genes that significantly change in monocytes to engrafted ileum macrophages only. Green dots: genes that significantly change from monocytes to engrafted colon macrophages only. Only genes that significantly changed from monocytes to both colonic and ileal macrophages at day 4, but expression levels not distinct between colon and ileum at day 4, were selected. (B) Log averages of all genes that are up-regulated (left) or down-regulated (right) in generic intestinal macrophages compared to monocytes. Red line marks threshold (50 reads, 5.672 in log2) of very low/no expression levels. (C) Top 5 GO pathways that are related to genes that are 'selectively expressed in generic intestinal macrophages compared with monocytes (left) or selectively expressed in monocytes compared with macrophages (right). Bars show percent of genes (out of total genes) that are related to each GO term, red markers illustrate the p-value of each GO term. (D) Example genes from GO pathways. Bars indicate mean normalized reads, error bars represent SEM.
Figure 5.
Figure 5.. Transcription factors which change during intestinal macrophage differentiation.
(A) Expression graphs of 3 TF families: Cebp (left), E2f (middle) and Egr (right). Lines mark average normalized reads, error bars represent SEM. (B) Representative TFs that are down-regulated in generic intestinal macrophages. (C) Representative TFs that are up-regulated in generic intestinal macrophages.
Figure 6.
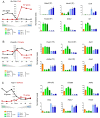
Figure 6.. Gene expression changes in Ly6C+ monocytes after differentiating to tissue-resident cells.
(A) Scheme of monocyte development and fates during physiology and inflammation. (B) Fold change heat map of all 1303 genes that significantly change during the transition of Ly6C+ blood monocytes to Ly6C- blood monocytes and BM Ly6C+ monocytes to engrafted intestinal macrophages at day 4. Colors represent fold change between tissue-resident cells and their respective precursor cells. (Supplementary file 1, data sets 1, 2, 5, 12,13). (C) Representative monocyte-related genes. (D) Representative genes related to monocyte-derived cells. (E) Expression of TFs of the Cebp and Irf gene families.
Figure 6—figure supplement 1.
Figure 6—figure supplement 1.. Gating strategy for sorting of Ly6C+ and Ly6C- blood monocytes.
Representative flow cytometric analysis indicating gates used for isolation of blood monocyte subsets.

Similar articles

Cited by

References

    1. Amit I, Winter DR, Jung S. The role of the local environment and epigenetics in shaping macrophage identity and their effect on tissue homeostasis. Nature Immunology. 2016;17:18–25. doi: 10.1038/ni.3325. - DOI - PubMed
    1. Auffray C, Fogg D, Garfa M, Elain G, Join-Lambert O, Kayal S, Sarnacki S, Cumano A, Lauvau G, Geissmann F. Monitoring of blood vessels and tissues by a population of monocytes with patrolling behavior. Science. 2007;317:666–670. doi: 10.1126/science.1142883. - DOI - PubMed
    1. Avraham-Davidi I, Yona S, Grunewald M, Landsman L, Cochain C, Silvestre JS, Mizrahi H, Faroja M, Strauss-Ayali D, Mack M, Jung S, Keshet E. On-site education of VEGF-recruited monocytes improves their performance as angiogenic and arteriogenic accessory cells. The Journal of Experimental Medicine. 2013;210:2611–2625. doi: 10.1084/jem.20120690. - DOI - PMC - PubMed
    1. Aychek T, Mildner A, Yona S, Kim K-W, Lampl N, Reich-Zeliger S, Boon L, Yogev N, Waisman A, Cua DJ, Jung S. IL-23-mediated mononuclear phagocyte crosstalk protects mice from Citrobacter rodentium-induced colon immunopathology. Nature Communications. 2015;6:6525. doi: 10.1038/ncomms7525. - DOI - PMC - PubMed
    1. Bain CC, Mowat AM. Intestinal macrophages - specialised adaptation to a unique environment. European Journal of Immunology. 2011;41:2494–2498. doi: 10.1002/eji.201141714. - DOI - PubMed

Publication types

Associated data