. 2020 Jan 7;11(1):7.
doi: 10.1038/s41467-019-13787-x.

Transmission of tauopathy strains is independent of their isoform composition

Affiliations

Transmission of tauopathy strains is independent of their isoform composition

Zhuohao He et al. Nat Commun. .

Abstract

The deposition of pathological tau is a common feature in several neurodegenerative tauopathies. Although equal ratios of tau isoforms with 3 (3R) and 4 (4R) microtubule-binding repeats are expressed in the adult human brain, the pathological tau from different tauopathies have distinct isoform compositions and cell type specificities. The underlying mechanisms of tauopathies are unknown, partially due to the lack of proper models. Here, we generate a new transgenic mouse line expressing equal ratios of 3R and 4R human tau isoforms (6hTau mice). Intracerebral injections of distinct human tauopathy brain-derived tau strains into 6hTau mice recapitulate the deposition of pathological tau with distinct tau isoform compositions and cell type specificities as in human tauopathies. Moreover, through in vivo propagation of these tau strains among different mouse lines, we demonstrate that the transmission of distinct tau strains is independent of strain isoform compositions, but instead intrinsic to unique pathological conformations.


Conflict of interest statement

The authors declare no competing interests.

Figures
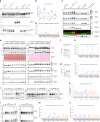
Fig. 1
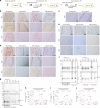
Fig. 1. Characterization of the new 6hTau and T44mTauKO Tg mice.
a Comparison of total tau expression levels among the hT-PAC-N, 6hTau, WT, and T44mTauKO mouse lines, as well as human brain tau. Homogenates from cortices of the different mouse lines at the age of around 3 months or from normal human brains were probed with pan tau antibody K9JA, Mtau selective antibody T49, and Htau selective antibody T14. GAPDH served as a loading control. b Quantification of the relative total tau expression levels among the different brains as shown in a, n = 3 for each group. c Tau isoform expression pattern among brains of the different lines. Tau in brain homogenates were dephosphorylated with lambda protein phosphatase and probed, respectively, with antibodies K9JA and Tau5, 4R isoform tau-specific polyclonal antibody 4R Tau and 3R isoform tau-specific Mab RD3. The recombinant (re) six human tau isoforms were, respectively, loaded as standards on the right lanes. 6hTau mouse line express only human six tau isoforms, while T44mTauKO mouse line express only the shortest human 3R tau isoform, 0N3R. Loading control GAPDH were probed using same amounts of lysates without dephosphorylation. d Quantification of different tau isoform expression pattern in each mouse line. e developmental expression pattern of total tau and isoforms in WT and 6hTau mice at indicated ages. rh6hTau, recombinant six human tau isoforms. Quantification of the relative total tau expression levels in f, WT and g, 6hTau mice. Different isoform expression patterns during developmental stages in h WT and i 6hTau mice. j Blot images and k Quantifications for brain regional expression patterns of total tau among WT, 6hTau, T44, T44mTauKO mouse lines, and normal human brains were probed by tau antibody K9JA. GAPDH served as a loading control. l immunoblot images and quantifications of tau isoform expression patterns in different brain regions in m adult 6hTau mice and n normal human controls. OB olfactory bulb, Hpx hippocampus, Ctx cortex, CB cerebellum, BS brainstem, SC spinal cord, Fron frontal cortex, Temp temporal cortex, Occi occipital cortex, Puta putamen. Quantifications are presented as mean ± s.e.m., with each dot representing an individual. Source data is available as a Source Data file.
Fig. 2
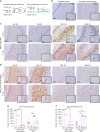
Fig. 2. Isoform-specific seeding pattern is unaltered during repeated propagation.
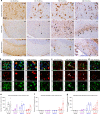
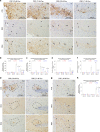
a Schematic showing in vivo propagation paradigm in 6hTau mice. Similar amounts of human tau strains (P0) were injected into the hippocampus of naive 6hTau mice for 1st round transmission and 3 months later, the hippocampi were dissected and extracted using detergent to obtain the induced tau strain (P1). The P1 tau strain was re-injected into the hippocampus of naive 2nd round transmission 6hTau mice, and the induced P2 tau pathologies were extracted similarly as P1 and injected into the hippocampus of 3rd round of 6hTau mice. Representative IHC staining in panel b using MAbs AT8, MAb RD3 (3R isoform tau-selective) and MAb RD4 (4R tau isoform-specific) on adjacent brain sections from 6hTau mice injected with equal amounts of P0-tau from different human tau strains; or c with control lysate from normal human brains Ctrl_P0 or non-injected aged 6hTau mouse brains Ctrl_P1; or d with induced P1-tau; or e with induced P2-tau at 3 m.p.i. The P1 injection doses were 0.1–0.5 μg per site, and P2 were 0.01–0.03 μg per site, while the P0 were 1 μg per site. Biochemical extraction of induced f P1 from strain_P0–6hTau and g P2 from strain_P1–6hTau mice with 0.1% sarkosyl. The sarkosyl-insoluble tau were probed with Mab RD3, Mab RD4, and polyclonal anti-4R Tau-specific antibody to examine the isoform compositions in the induced pathologies. Open arrowheads indicate 3R Tau immunobands, and solid arrowheads indicate 4R Tau bands. Asterisks indicate the non-specific immunoreactive bands near 50 KDa, respectively, shown in RD3 and 4RTau blots. Equal proportion of sarkosyl-soluble fractions were loaded, and f 15-fold fraction from strain_P1 or g 40-fold fraction from strain_P2 mice were loaded as sarkosyl-insoluble fraction. h Quantification of b from strain_P0; i quantification of d from strain_P1, and j quantification of e from strain_P2 induced neuronal tau pathologies, respectively, indicated by AT8, RD3, and RD4. Only ipsilateral hippocampus (iHpx) were quantified for each mouse. Data are presented as mean ± s.e.m. n= 3–6 mice per each group. Multiple t-tests were performed. Source data is available as a Source Data file.
Fig. 3
Fig. 3. Tau strain was inefficient in cross-seeding non-corresponding isoform.
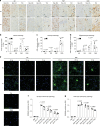
a Schematic showing the cross-seeding experiment paradigm whereby different tau strains extracted from human tauopathy brains were injected into the hippocampus and overlying cortex of either 4R tau-expressing (WT) or 3R tau-expressing (T44mTauKO) mice, respectively, to examine whether tau strains could cross-seed non-corresponding tau isoforms. The injection dose for strain_P0 were 1 μg per site. b representative IHC staining with MAb AT8 on brain sections from WT mice injected with control brain lysate at 9 m.p.i., and the brain sections from T44mTauKO mice injected with control brain extracts at 6 m.p.i. No significant tangle-like tau pathologies were observed in any of mice injected with the control lysates. c Representative IHC staining with AT8 on brain sections from WT mice injected with similar amounts of distinct human tau strains (P0) at 3 and 6 m.p.i. d Representative IHC staining with AT8 on brain sections from T44mTauKO mice injected with similar amounts of different human tau strains (P0) at 3 and 6 m.p.i. Note that AD-tau induced most abundant tau pathologies, including massive neuropil-like tau pathologies, which masked the NFTs in the hippocampal DG regions. Inserts in bd are images with lower magnifications. Quantification of the AT8-positive cells in WT or T44mTauKO mice, respectively, injected with different human tau strains are shown in e for 3 m.p.i. and f for 6 m.p.i. time points. Both ipsilateral and contralateral sides were quantified together for each mouse. Data are presented as mean ± s.e.m. n = 3–7 in each group, and each dot represents a mouse. One-way ANOVA with Sidak’s multiple comparisons tests were performed. *p < 0.05; **p < 0.001; ***p < 0.001. Source data is available as a Source Data file.
Fig. 4
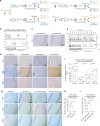
Fig. 4. Isoform-specific seeding pattern is independent of isoform-composition.
a Experimental paradigm showing how human tau strains were converted into AD-3R, AD-4R, PiD-3R, or PSP-4R tau strains through in vivo propagation in mice expressing only 3R tau (T44mTauKO) or only 4R tau (WT). b Immunoblots of the transformed tau strains using 3R (RD3) or 4R isoform-selective antibody (4RTau), respectively. Equal proportion of sarkosyl-soluble fractions were loaded, and twofold fraction from T44mTauKO mice or 20-fold from WT mice were loaded as sarkosyl-insoluble fractions. c Representative IHC staining with AT8 on brain sections from 6hTau mice injected with 3R tau control lysate extracted from non-injected T44mTauKO mice or 4R tau control lysate extracted from non-injected WT mice at 3 m.p.i. d Representative IHC staining with AT8, RD3, and RD4 on adjacent brain sections from 6hTau mice injected with similar amount of AD-3R, AD-4R, PiD-3R, and PSP-4R tau. e Immunoblots of the induced tau pathologies in 6hTau mice by different tau strains with isoform-specific tau antibodies. Equal proportion of sarkosyl-soluble fraction and 7.5-fold for AD_3R, 52.5-fold for PiD_3R, 40-fold for AD_4R, and 52.5-fold for PSP_4R induced sarkosyl-insoluble fraction samples were loaded. rhT44 and rhT40 are recombinant human 0N3R and 2N4R tau isoforms, respectively. 3R tau-positive bands, open arrowheads; 4R tau-positive bands, solid arrowheads. Asterisks indicate non-specific blot bands. f Quantification of AT8-, RD3- and RD4-positive neurons in the 6hTau mice injected with distinct lysates as shown in d. n = 3 mice per group. One-way ANOVA with multiple t-tests were performed. g IHC staining with AT8 in the WT mice injected with similar amounts of AD-3R and PiD-3R tau, and in the T44mTauKO mice injected with similar amounts of AD-4R and PSP-4R tau. Quantification of AT8-positive tau pathologies in h AD-3R and PiD-3R tau injected 4R tau mice, and i AD-4R and PiD-4R tau injected 3R tau mice. Three mice per group were quantified. Data are presented as mean ± s.e.m. and each dot represents a mouse. One-tailed Mann–Whitney tests were performed. Only ipsilateral hippocampus (iHpx) were quantified for each mouse.
Fig. 5
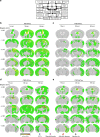
Fig. 5. Distribution of induced tau pathologies in 6hTau mice.
a Neuroanatomic connectome map showing the anterograde and retrograde connections between the injection site (dorsal hippocampus) and other major brain regions. The distribution of the induced tau aggregates in 6hTau mice by different b AD; c PiD; d CBD, and e PSP tau strains were mapped and shown in five representative coronal brain sections at Bregma levels mm: −0.22, −1.22, −2.18, −2.92, −3.25. Neuropil threads were indicated using the heatmap, with gray color indicating no and red color indicating abundant neuropil threads. Neuronal tau pathologies are marked by blue dots, astrocytic tau pathologies are shown as red stars and oligodendrocyte tau pathologies are marked by purple dots. The density of the dots reflects the relative abundance of these tau pathologies. Injection sites are marked with black stars. Mice were examined at 1, 3, and 6 m.p.i., and each group contained 3–6 mice.
Fig. 6
Fig. 6. Distinct cell-type-specific tau strains were recapitulated in new model.
a Representative IHC staining with AT8 on brain sections from 6hTau mice unilaterally inoculated with distinct human tau strains (P0) at 3 m.p.i. The upper panels showing neuronal tau pathologies in the hippocampus. Middle panels showing white matter with oligodendrocyte tau pathologies induced by PSP_P0 and CBD_P0. The lower panels show tufted-astrocyte-like tau pathologies induced by PSP_P0 and astrocytic plaque-like tau pathologies induced by CBD_P0 in the hippocampus. Oligodendrocytic and astrocytic tau pathologies are indicated by solid and open arrowheads, respectively. Representative double immunofluorescence staining with anti-hyperphosphorylated tau MAb AT8 and b neuronal marker NeuN; c oligodendrocytic marker, Oligo2 and d astrocytic marker GFAP on the pathologies induced, respectively, by strain_P0 in 6hTau mice. Neuronal, oligodendrocytic and astrocytic tau pathologies are indicated by white arrowheads, white arrows and dashed circle, respectively. Quantification of e neuronal; f astrocytic and g oligodendrocytic tau pathologies in the 6hTau mice inoculated with distinct P0 human tau strains at 1, 3, and 6 m.p.i. Both ipsilateral and contralateral sides were quantified together for each mouse. Data are presented as mean ± s.e.m.. n = 3–6 for each group, and each dot represents a mouse subjected to quantitation. WM white matter, Fim fimbria, Cc corpus callosum, Hpx, hippocampus. Source data is available as a Source Data file.
Fig. 7
Fig. 7. Tau isoform compositions in the induced glial pathologies.
Representative IHC staining of induced (a) oligodendrocytic and d astrocytic tau pathologies induced in 6hTau mice injected with P0- and P1-tau as shown in Fig. 2b and d using AT8, RD3, and RD4 antibodies on adjacent brain sections. Quantification of induced oligodendrocytic tau pathologies in b strain_P0- and c strain_P1–6hTau mice. Quantification of induced astrocytic tau pathologies in e strain_P0- and f strain_P1-6hTau mice. n= 3–6 mice per group were quantified, and multiple t-test were performed. g representative IHC staining and h quantification of oligodendrocytic tau pathologies in PSP_4R-6hTau mice as shown in Fig. 4d. n = 3 mice per group were quantified, and multiple t-test were performed. Quantifications were from ipsilateral brain side (i) of each mouse. Data are presented as mean ± s.e.m. Significant differences were considered when p ≤ 0.05. WM white matter, Fim fimbria, Hpx hippocampus. Solid arrowheads indicate oligodendrocytic pathologies, and dashed circles indicate astrocytic pathologies. Source data is available as a Source Data file.
Fig. 8
Fig. 8. Tau strains maintained their potencies during in vivo propagation.
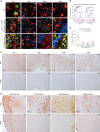
a Representative IHC staining with AT8 on brain sections from 6hTau mice unilaterally inoculated with 0.2 μg tau strain extracted either from primary human diseased brains (P0) or strain_P0 injected 6hTau mice (P1). The total protein in P0 and P1 lysates were also adjusted the same using non-injected 6hTau brain lysates. The DG region of ventral hippocampus showed neuronal tau pathologies in all the cases. The astrocytic and oligodendrocytic tau pathologies induced by PSP and CBD strains are, respectively, shown in the hippocampal CA regions and the fimbria white matter region. Quantification in b neuronal; c astrocytic, and d oligodendrocytic tau pathologies in the ipsilateral sides (i) of 6hTau mice injected with strain_P0/P1 shown in a. Two-tailed t-tests were performed with significant difference where p ≤ 0.05. Data are presented as mean ± s.e.m. and each dot represents a mouse. Hpx hippocampus, DG dentate gyrus, CA cornu ammonis, Fim fimbria, WM white matter. Quantifications were from ipsilateral (i) sides. e Representative ICC staining with anti-mouse tau antibody R2295M on primary mouse neurons treated with AD_P0/P1 or PSP_P0/P1 at three dosages (10, 20, and 40 ng) per well. Control (Ctrl) brain lysate was extracted in the same way as strain_P1 from non-injected old 6hTau mouse brains. The amount of Ctrl lysate was matched to the total protein of AD_P1 40 ng, which contains the highest total protein. AD_P0/P1 all induced tau aggregate in the neuropil, while PSP_P0/P1 also induced obvious tau aggregate in somas. Scale bar, 50 μm. Relative quantification in f AD strains and g PSP strains. The normalization was made to DAPI counts and then, respectively, to AD_P0 40 ng dose for AD strains, or PSP_P0 40 ng dose for PSP strains. Data are presented as mean ± s.e.m. and each dot represents a batch repeat. One-way ANOVA with multiple comparisons were performed. Significant differences were considered when p ≤ 0.05. Source data is available as a Source Data file.
Fig. 9
Fig. 9. Distinct tau strains harbored distinct conformations.
a Representative immunostaining with anti-hyperphosphorylated tau MAb AT8, the β-sheet amyloid dye Thioflavin S and nuclear DAPI stain on brain sections from: upper panel, the different human tauopathy brains used for extracting human tau strains; middle and lower panels, the AD_, PiD_, CBD_ and PSP_P0-6hTau mice at 3 and 6 m.p.i., respectively. Purple frame inserts show the Thioflavin S staining in white frame areas. Scale bars in the purple frames represent 5 μm. The differences in the amounts of β-sheet structure indicated by the percentage of Thioflavin S-positive pathologies in 6hTau mice injected with distinct human tau strains at two different time points were quantified in b. Data are presented as mean ± s.e.m. n = 3–6 for each group, with each dot representing a mouse. One-way ANOVA with Sidak’s multiple comparisons tests were performed. *p < 0.05; **p < 0.001; ***p < 0.001. c IHC staining on adjacent human tauopathy brain sections using MAbs AT8 and conformational-dependent GT38 specific for AD tau. d Representative IHC staining with AT8 and GT38 MAbs in 6hTau mice and e quantification of the paired adjacent brain sections from 6hTau mice injected with distinct tau strains. The amount of GT38 MAb AD-like “conformation” was determined by the percentage of GT38-positive pathologies among the 6hTau mice injected with distinct human tau strains. Data are presented as mean ± s.e.m. One-way ANOVA was performed for statistical analysis. Cing cingulate, Lenti lentiform, Front ctx frontal cortex, Hpx hippocampus, Amy amygdala. Source data is available as a Source Data file.

Similar articles

Cited by

References

    1. Lee VM, Goedert M, Trojanowski JQ. Neurodegenerative tauopathies. Annu. Rev. Neurosci. 2001;24:1121–1159. doi: 10.1146/annurev.neuro.24.1.1121. - DOI - PubMed
    1. Irwin DJ, et al. Frontotemporal lobar degeneration: defining phenotypic diversity through personalized medicine. Acta Neuropathologica. 2015;129:469–491. doi: 10.1007/s00401-014-1380-1. - DOI - PMC - PubMed
    1. Brettschneider J, Del Tredici K, Lee VM, Trojanowski JQ. Spreading of pathology in neurodegenerative diseases: a focus on human studies. Nat. Rev. Neurosci. 2015;16:109–120. doi: 10.1038/nrn3887. - DOI - PMC - PubMed
    1. Goedert M, Spillantini MG, Jakes R, Rutherford D, Crowther RA. Multiple isoforms of human microtubule-associated protein tau: sequences and localization in neurofibrillary tangles of Alzheimer’s disease. Neuron. 1989;3:519–526. doi: 10.1016/0896-6273(89)90210-9. - DOI - PubMed
    1. LoPresti P, Szuchet S, Papasozomenos SC, Zinkowski RP, Binder LI. Functional implications for the microtubule-associated protein tau: localization in oligodendrocytes. Proc. Natl Acad. Sci. USA. 1995;92:10369–10373. doi: 10.1073/pnas.92.22.10369. - DOI - PMC - PubMed

Publication types

LinkOut - more resources