. 2020 Jan 1;10(1):247-264.
doi: 10.7150/thno.37200. eCollection 2020.

ASIC1a induces synovial inflammation via the Ca2+/NFATc3/ RANTES pathway

Affiliations

ASIC1a induces synovial inflammation via the Ca2+/NFATc3/ RANTES pathway

Yihao Zhang et al. Theranostics. .

Abstract

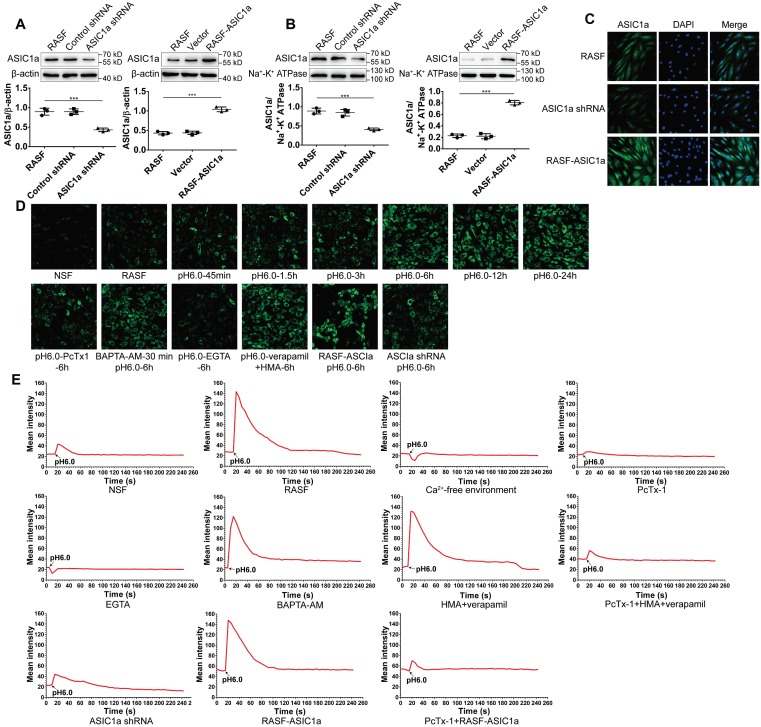
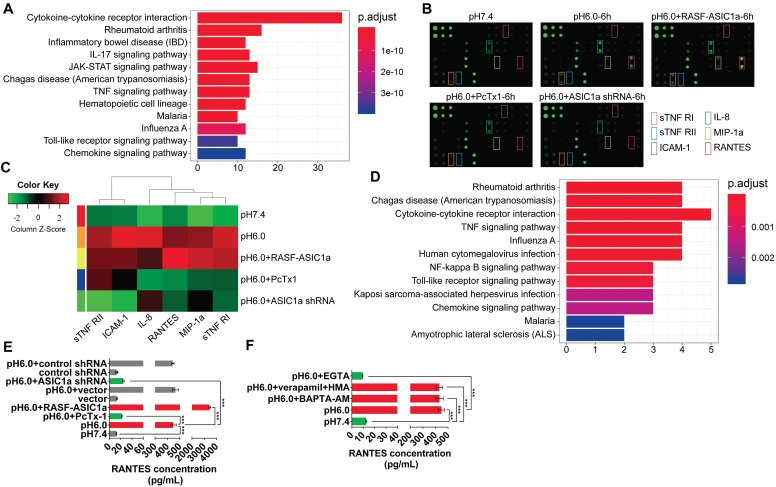
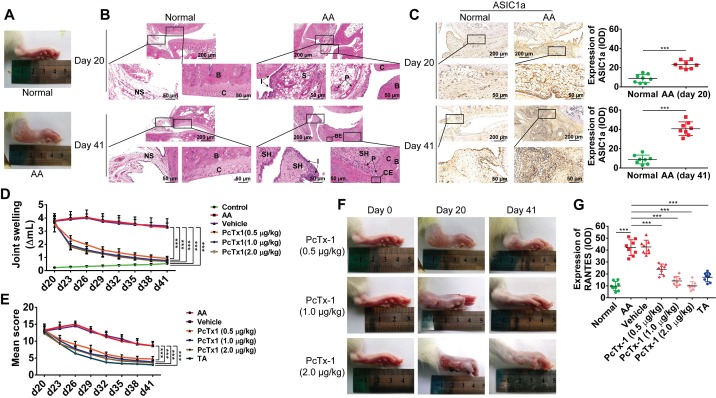
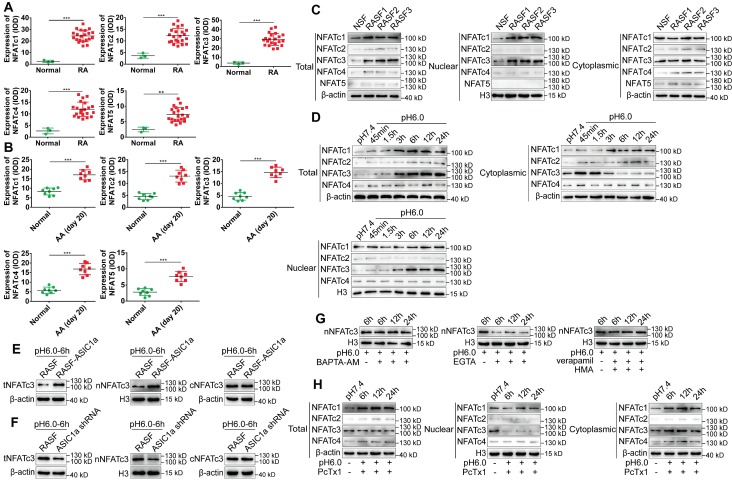
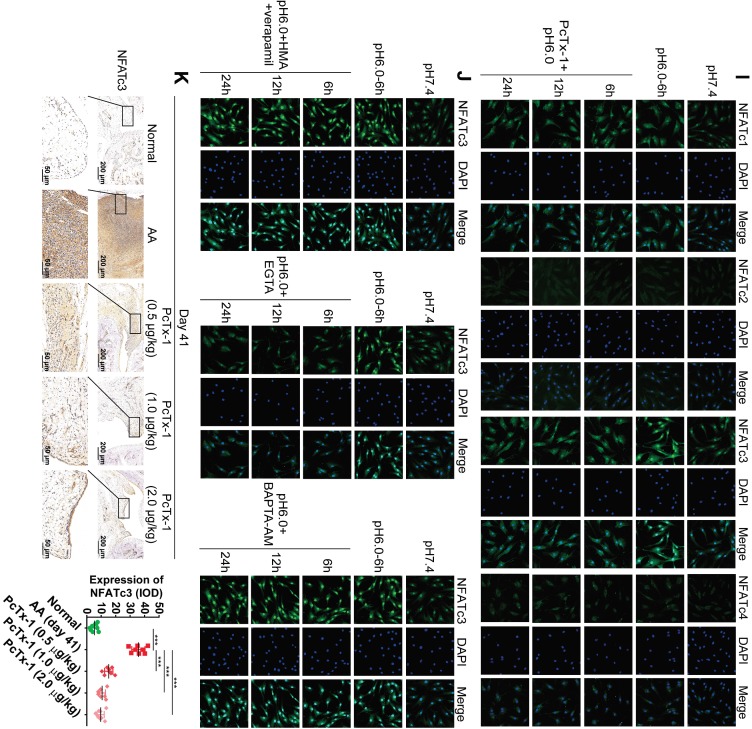
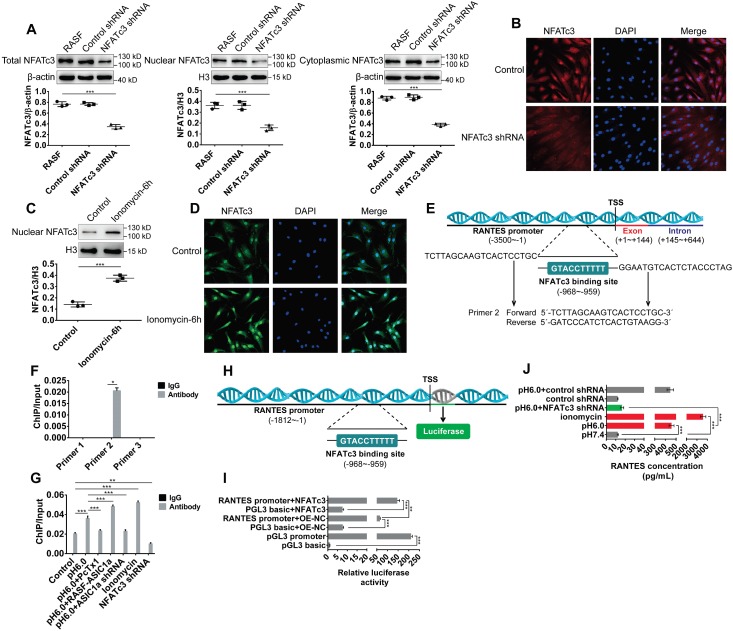
Rationale: Synovial inflammation is one of the main pathological features of rheumatoid arthritis (RA) and is a key factor leading to the progression of RA. Understanding the regulatory mechanism of synovial inflammation is crucial for the treatment of RA. Acid-sensing ion channel 1a (ASIC1a) is an H+-gated cation channel that promotes the progression of RA, but the role of ASIC1a in synovial inflammation is unclear. This study aimed to investigate whether ASIC1a is involved in the synovial inflammation and explore the underlying mechanisms in vitro and in vivo. Methods: The expression of ASIC1a and nuclear factor of activated T cells (NFATs) were analyzed by Western blotting, immunofluorescence, and immunohistochemistry both in vitro and in vivo. The Ca2+ influx mediated by ASIC1a was detected by calcium imaging and flow cytometry. The role of ASIC1a in inflammation was studied in rats with adjuvant-induced arthritis (AA). Inflammatory cytokine profile was analyzed by protein chip in RA synovial fibroblasts (RASF) and verified by a magnetic multi-cytokine assay and ELISA. The NFATc3-regulated RANTES (Regulated upon activation, normal T cell expressed and secreted) gene transcription was investigated by ChIP-qPCR and dual-luciferase reporter assay. Results: The expression of ASIC1a was significantly increased in human RA synovial tissues and primary human RASF as well as in ankle synovium of AA rats. Activated ASIC1a mediated Ca2+ influx to increase [Ca2+]i in RASF. The activation/overexpression of ASIC1a in RASF up-regulated the expression of inflammatory cytokines RANTES, sTNF RI, MIP-1a, IL-8, sTNF RII, and ICAM-1 among which RANTES was increased most remarkably. In vivo, ASIC1a promoted inflammation, synovial hyperplasia, articular cartilage, and bone destruction, leading to the progression of AA. Furthermore, activation of ASIC1a upregulated the nuclear translocation of NFATc3, which bound to RANTES promoter and directly regulated gene transcription to enhance RANTES expression. Conclusion: ASIC1a induces synovial inflammation, which leads to the progression of RA. Our study reveals a novel RA inflammation regulatory mechanism and indicates that ASIC1a might be a potential therapeutic target for RA.

Keywords: ASIC1a; NFATc3; inflammation; rheumatoid arthritis.


Conflict of interest statement

Competing Interests: The authors have declared that no competing interest exists.

Figures

Figure 1
Figure 1
ASIC1a is highly expressed in human RA synovial tissues and primary human RASF. (A) Immunohistochemistry analysis of ASIC1a expression in human normal and RA synovial tissues. (B) Immunofluorescence analysis of ASIC1a expression in human normal and RA synovial tissues. The scale bars are 100 μm. (C) Cells identified by flow cytometry. (D) Western blot analysis of total ASIC1a expression in NSF and RASF. (E) Western blot analysis of membrane ASIC1a expression in NSF and RASF. (F) Membrane ASIC1a expression detected by flow cytometry. MFI, is mean fluorescence intensity. (G) Immunofluorescence analysis of ASIC1a expression in NSF and RASF. The scale bars are 20 μm. Student´s t-test or one-way ANOVA was used for statistical analysis, and data are expressed as mean ± SEM for three separate experiments.
Figure 2
Figure 2
ASIC1a has an ion channel activity that mediates Ca2+ influx. (A) Total ASIC1a protein was detected by Western blotting in RASF-ASIC1a transfectants and ASIC1a shRNA transfectants. (B) Membrane ASIC1a protein was detected by Western blotting in RASF-ASIC1a transfectants and ASIC1a shRNA transfectants. (C) Immunofluorescence analysis of ASIC1a expression in RASF-ASIC1a transfectants and ASIC1a shRNA transfectants. The scale bars are 20 μm. (D) Calcium imaging detected the effect of ASIC1a on [Ca2+]i in RASF with 100 nM PcTx-1, 1 mM EGTA, 10 μM BAPTA-AM, 5 μM verapamil and HMA (E) Calcium imaging detected ASIC1a-mediated Ca2+ influx in RASF with 100 nM PcTx-1, 1 mM EGTA, 10 μM BAPTA-AM, 5 μM verapamil and HMA. Student´s t-test or one-way ANOVA was used for statistical analysis, and data are expressed as mean ± SEM for three separate experiments.
Figure 3
Figure 3
ASIC1a upregulates the expression of inflammatory cytokines by mediating Ca2+ influx. (A) 40 inflammatory cytokines were analyzed by KEGG pathway enrichment analysis. (B) An inflammatory cytokines antibody array was used to examine the expression of 40 inflammatory cytokines in RASF with 100 nM PcTx-1. (C) Semi-quantitative analysis of the expressions of RANTES, sTNF RI, MIP-1a, IL-8, sTNF RII, and ICAM-1 by fluorescence intensity presented by heat map. (D) RANTES, sTNF RI, MIP-1a, IL-8, sTNF RII, and ICAM-1 were analyzed by KEGG pathway enrichment analysis. (E) The expression of RANTES was determined by magnetic multi-cytokine assay. Cells were treated for 6 h with100 nM PcTx-1. (F) Magnetic multi-cytokine assay detected the increase of RANTES expression mediated by ASIC1a in RASF treated for 6 h with 1 mM EGTA, 10 μM BAPTA-AM, 5 μM verapamil and HMA. Student´s t-test or one-way ANOVA was used for statistical analysis, and data are expressed as mean ± SEM for three separate experiments.
Figure 4
Figure 4
ASIC1a promotes inflammation by mediating the expression of inflammatory cytokines in vivo. (A) Representative image of right hind paw edema in rats with adjuvant-induced arthritis (AA) on day 20. (B) Normal and AA rat right hind ankle joint sections stained with hematoxylin and eosin. Histological section showing subchondral bone (B), bone erosion (BE), articular cartilage (C), cartilage erosion (CE), inflammatory cell infiltration (I), normal synovium (NS), pannus formation (P), synovium (S), and synovial hyperplasia (SH). (C) Immunohistochemistry analysis of ASIC1a expression in rat ankle synovium (n = 8). (D) The right hind paws of rats were measured by toe volume measuring instrument on day 0, 20, 23, 26, 29, 32, 35, 38, and 41. (E) Rat arthritic severity in each paw was evaluated by using a scoring system. (F) Representative image of right hind paw edema in rats treated with 0.5, 1, and 2 μg/kg PcTx-1. (G) Semi-quantitative analysis of RANTES expression in rat ankle synovium by integral optical density (IOD). Student´s t-test or one-way ANOVA was used for statistical analysis, and data are expressed as mean ± SEM for three separate experiments.
Figure 5
Figure 5
ASIC1a induces nuclear translocation of NFATc3 by mediating Ca2+ influx. (A) Semi-quantitative analysis of NFATc1-4 and NFAT5 expressions in human normal and RA synovial tissues by integral optical density (IOD). (B) Semi-quantitative analysis of NFATc1-4 and NFAT5 expressions in rat ankle synovium by integral optical density (IOD). (C) Western blot analysis of total, nuclear, and cytoplasmic NFATc1-4 and NFAT5 expressions in NSF and RASF. (D) Western blot analysis of total, nuclear, and cytoplasmic NFATc1-4 expressions in RASF in an acidic environment (pH 6.0). (E) Western blot analysis of total NFATc3 (tNFATc3), nuclear NFATc3 (nNFATc3), and cytoplasmic NFATc3 (cNFATc3) expression in RASF-ASIC1a transfectants treated with pH 6.0 for 6 h. (F) Western blot analysis of total NFATc3 (tNFATc3), nuclear NFATc3 (nNFATc3) and cytoplasmic NFATc3 (cNFATc3) expression in ASIC1a shRNA transfectants treated with pH 6.0 for 6 h. (G) Western blot analysis of Nuclear NFATc3 (nNFATc3) proteins in RASF with 1 mM EGTA, 10 μM BAPTA-AM, 5 μM verapamil and HMA. (H) Western blot analysis of total, nuclear and cytoplasmic NFATc1-4 proteins in with 100 nM PcTx-1 were used in the experiment. (I) Immunofluorescence analysis of NFATc1-4 expressions in RASF treated with pH 6.0 + 100 nM PcTx-1. The scale bars are 20 μm. (J) Immunofluorescence analysis of NFATc3 expression in RASF with 1 mM EGTA, 10 μM BAPTA-AM, 5 μM verapamil and HMA. The scale bars are 20 μm. (K) Immunohistochemistry analysis of NFATc3 expression in rat ankle synovium on day 41 (n = 8). Student´s t-test or one-way ANOVA was used for statistical analysis, and data are expressed as mean ± SEM for three separate experiments.
Figure 5
Figure 5
ASIC1a induces nuclear translocation of NFATc3 by mediating Ca2+ influx. (A) Semi-quantitative analysis of NFATc1-4 and NFAT5 expressions in human normal and RA synovial tissues by integral optical density (IOD). (B) Semi-quantitative analysis of NFATc1-4 and NFAT5 expressions in rat ankle synovium by integral optical density (IOD). (C) Western blot analysis of total, nuclear, and cytoplasmic NFATc1-4 and NFAT5 expressions in NSF and RASF. (D) Western blot analysis of total, nuclear, and cytoplasmic NFATc1-4 expressions in RASF in an acidic environment (pH 6.0). (E) Western blot analysis of total NFATc3 (tNFATc3), nuclear NFATc3 (nNFATc3), and cytoplasmic NFATc3 (cNFATc3) expression in RASF-ASIC1a transfectants treated with pH 6.0 for 6 h. (F) Western blot analysis of total NFATc3 (tNFATc3), nuclear NFATc3 (nNFATc3) and cytoplasmic NFATc3 (cNFATc3) expression in ASIC1a shRNA transfectants treated with pH 6.0 for 6 h. (G) Western blot analysis of Nuclear NFATc3 (nNFATc3) proteins in RASF with 1 mM EGTA, 10 μM BAPTA-AM, 5 μM verapamil and HMA. (H) Western blot analysis of total, nuclear and cytoplasmic NFATc1-4 proteins in with 100 nM PcTx-1 were used in the experiment. (I) Immunofluorescence analysis of NFATc1-4 expressions in RASF treated with pH 6.0 + 100 nM PcTx-1. The scale bars are 20 μm. (J) Immunofluorescence analysis of NFATc3 expression in RASF with 1 mM EGTA, 10 μM BAPTA-AM, 5 μM verapamil and HMA. The scale bars are 20 μm. (K) Immunohistochemistry analysis of NFATc3 expression in rat ankle synovium on day 41 (n = 8). Student´s t-test or one-way ANOVA was used for statistical analysis, and data are expressed as mean ± SEM for three separate experiments.
Figure 6
Figure 6
ASIC1a induces nuclear translocation of NFATc3 to regulate transcription of the RANTES gene. (A) Western blot analysis of total, nuclear, and cytoplasmic NFATc3 in NFATc3 shRNA transfectants. (B) Immunofluorescence analysis of NFATc3 expression in NFATc3 shRNA transfectants. The scale bars are 20 μm. (C) Western blot analysis of nuclear NFATc3 in RASF treated with 5μM ionomycin. (D) Immunofluorescence analysis of NFATc3 expression in RASF treated with 5μM ionomycin. The scale bars are 20 μm. (E) Schematic diagram of the primer 2-guided amplified DNA fragments (1005, 902) and predicted binding site for NFATc3 in the promoter region of the human RANTES gene. Transcription start site (TSS) of the RANTES promoter is +1. (F) Primer 1, 2, and 3 were used to detect the binding of NFATc3 to RANTES promoter region in untreated RASF by ChIP-qPCR assay. (G) Primer 2 was used to detect the binding of NFATc3 to RANTES promoter region in treated RASF by ChIP-qPCR assay in the presence of 5 μM ionomycin. (H) Schematic diagram of the promoter region of the human RANTES gene used for dual-luciferase reporter assay. Transcription start site (TSS) of the RANTES promoter is +1. (I) Dual-luciferase reporter assay showing regulation of RANTES transcription by direct binding of NFATc3 to the RANTES promoter region in RASF. pGL3 basic group and pGL3 promoter group served as negative and positive controls, respectively. (J) The expression of RANTES was determined in RASF treated with 5 μM ionomycin and NFATc3 shRNA transfectants by magnetic multi-cytokine assay. Student´s t-test or one-way ANOVA was used for statistical analysis, and data are expressed as mean ± SEM for three separate experiments.
Figure 7
Figure 7
Schematic diagram of the molecular mechanism of ASIC1a-induced synovial inflammation. ASIC1a mediates Ca2+ influx to enhance nuclear translocation of NFATc3, which binds to the RANTES promoter to directly regulate RANTES gene transcription and protein expression.

Similar articles

Cited by

References

    1. Aletaha D, Smolen JS. Diagnosis and Management of Rheumatoid Arthritis: A Review. Jama. 2018;320:1360–72. - PubMed
    1. Van der Woude D, van der Helm-van Mil AHM. Update on the epidemiology, risk factors, and disease outcomes of rheumatoid arthritis. Best Pract Res Clin Rheumatol. 2018;32:174–87. - PubMed
    1. Guo Q, Wang Y, Xu D, Nossent J, Pavlos NJ, Xu J. Rheumatoid arthritis: pathological mechanisms and modern pharmacologic therapies. Bone Res. 2018;6:15. - PMC - PubMed
    1. Ito H, Moritoshi F, Hashimoto M, Tanaka M, Matsuda S. Control of articular synovitis for bone and cartilage regeneration in rheumatoid arthritis. Inflamm Regen. 2018;38:7. - PMC - PubMed
    1. Boissier MC, Semerano L, Challal S. et al. Rheumatoid arthritis: from autoimmunity to synovitis and joint destruction. J Autoimmun. 2012;39:222–28. - PubMed

Publication types

MeSH terms