

Structural Energy Landscapes and Plasticity of the Microstates of Apo Escherichia coli cAMP Receptor Protein
- PMID: 31885251
- PMCID: PMC7187730
- DOI: 10.1021/acs.biochem.9b00895
Structural Energy Landscapes and Plasticity of the Microstates of Apo Escherichia coli cAMP Receptor Protein
Abstract
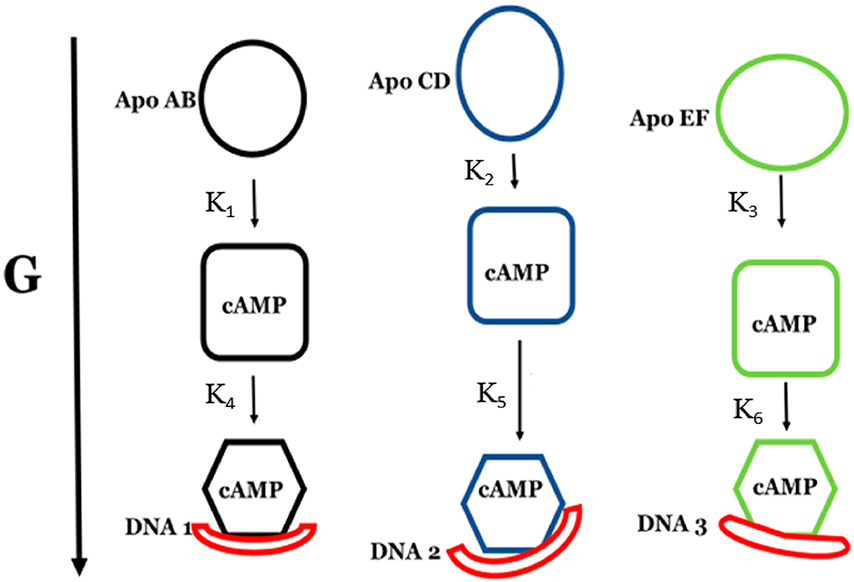
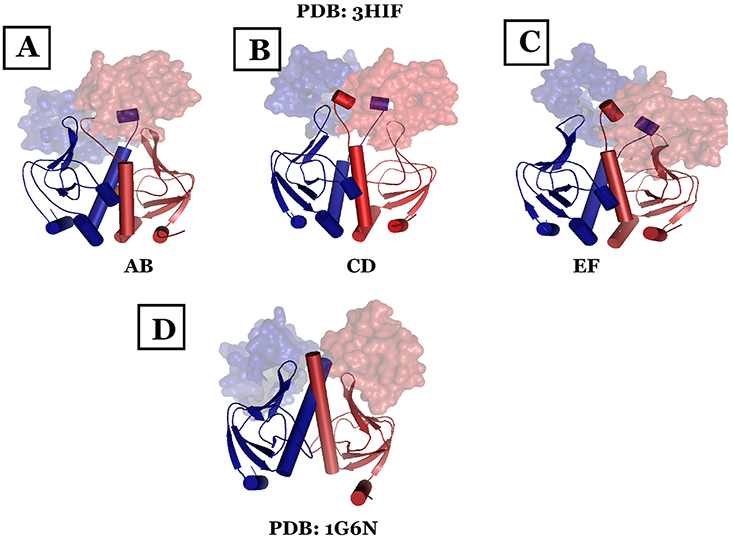
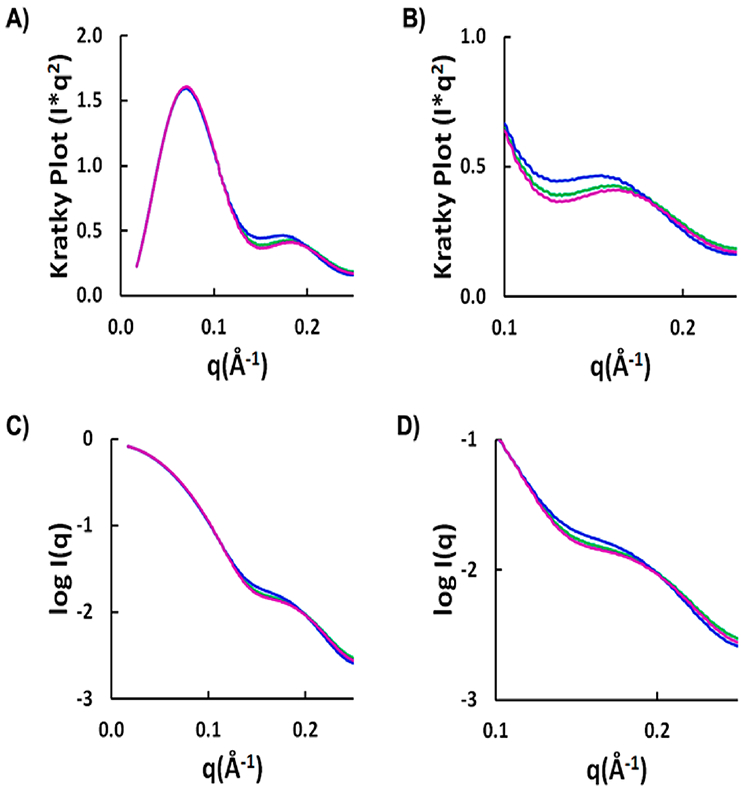
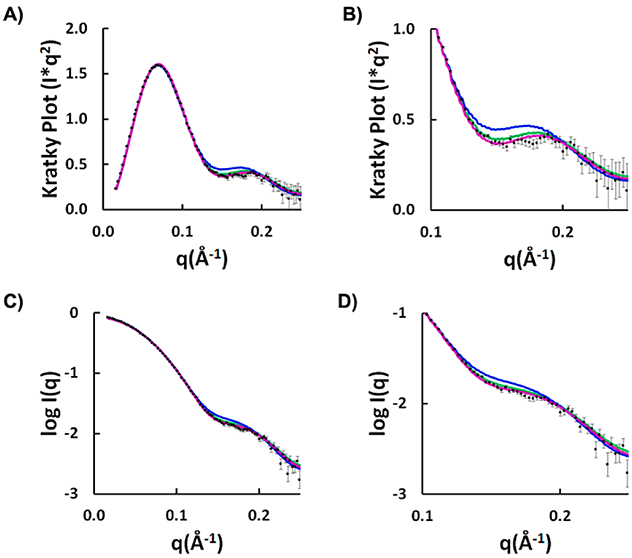
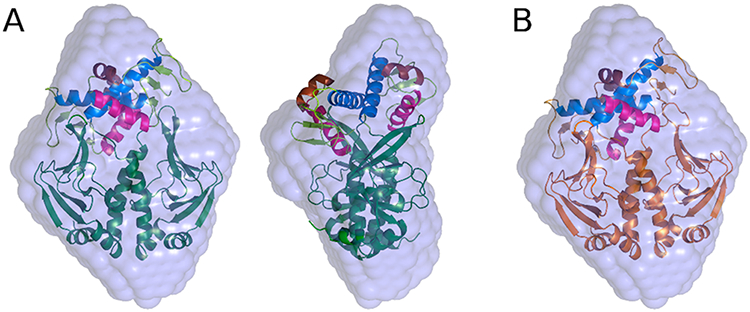
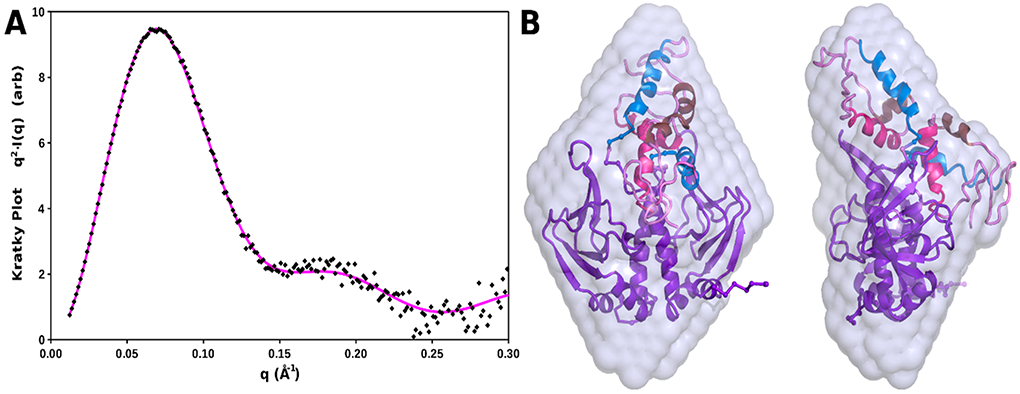
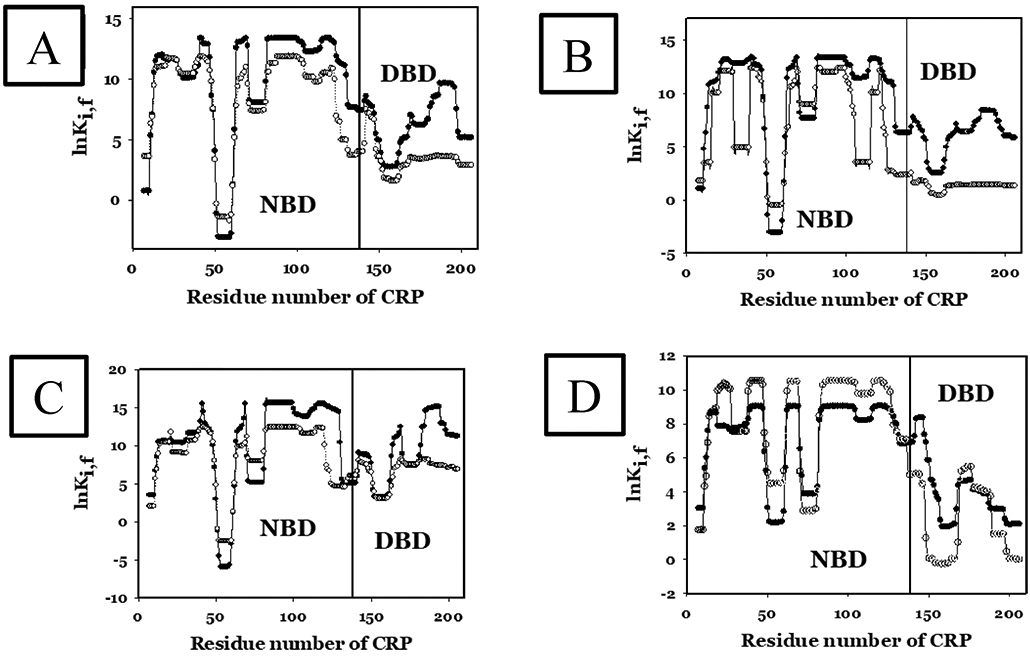
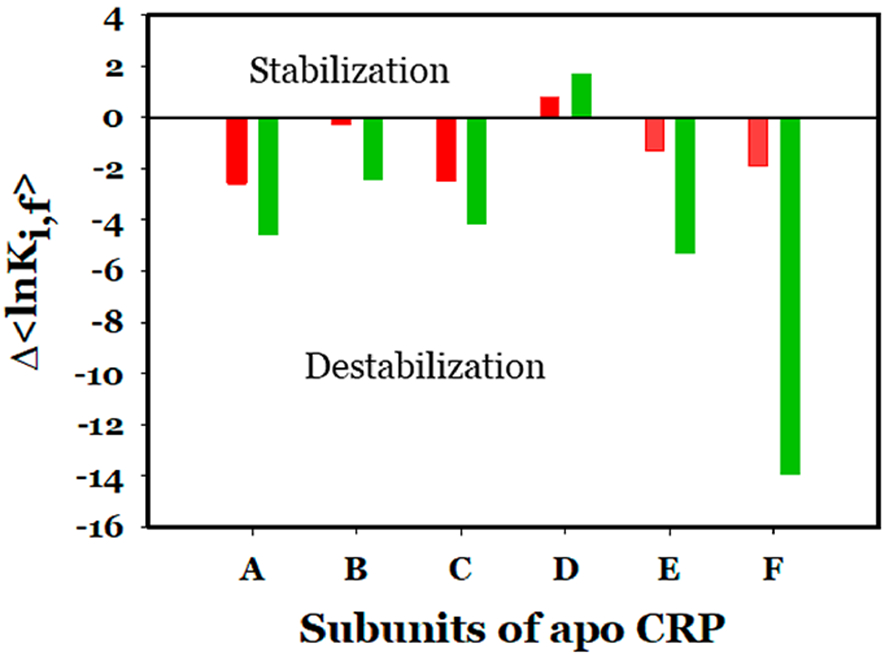
The theory for allostery has evolved to a modern energy landscape ensemble theory, the major feature of which is the existence of multiple microstates in equilibrium. The properties of microstates are not well defined due to their transient nature. Characterization of apo protein microstates is important because the specific complex of the ligand-bound microstate defines the biological function. The information needed to link biological function and structure is a quantitative correlation of the energy landscapes between the apo and holo protein states. We employed the Escherichia coli cAMP receptor protein (CRP) system to test the features embedded in the ensemble theory because multiple crystalline apo and holo structures are available. Small angle X-ray scattering data eliminated one of the three apo states but not the other two. We defined the underlying energy landscape differences among the apo microstates by employing the computation algorithm COREX/BEST. The same connectivity patterns among residues in apo CRP are retained upon binding of cAMP. The microstates of apo CRP differ from one another by minor structural perturbations, resulting in changes in the energy landscapes of the various domains of CRP. Using the differences in energy landscapes among these apo states, we computed the cAMP binding energetics that were compared with solution biophysical results. Only one of the three apo microstates yielded data consistent with the solution data. The relative magnitude of changes in energy landscapes embedded in various apo microstates apparently defines the ultimate outcome of the cooperativity of binding.
Figures
Similar articles
-
The N-terminal capping propensities of the D-helix modulate the allosteric activation of the Escherichia coli cAMP receptor protein.J Biol Chem. 2012 Nov 16;287(47):39402-11. doi: 10.1074/jbc.M112.404806. Epub 2012 Oct 3. J Biol Chem. 2012. PMID: 23035121 Free PMC article.
-
Steady-state and time-resolved fluorescence studies of conformational changes induced by cyclic AMP and DNA binding to cyclic AMP receptor protein from Escherichia coli.Eur J Biochem. 2003 Apr;270(7):1413-23. doi: 10.1046/j.1432-1033.2003.03497.x. Eur J Biochem. 2003. PMID: 12653996
-
Modulation of global low-frequency motions underlies allosteric regulation: demonstration in CRP/FNR family transcription factors.PLoS Biol. 2013 Sep;11(9):e1001651. doi: 10.1371/journal.pbio.1001651. Epub 2013 Sep 10. PLoS Biol. 2013. PMID: 24058293 Free PMC article.
-
Syn, anti, and finally both conformations of cyclic AMP are involved in the CRP-dependent transcription initiation mechanism in E. coli lac operon.Cell Biochem Funct. 2008 Jun;26(4):399-405. doi: 10.1002/cbf.1462. Cell Biochem Funct. 2008. PMID: 18338329 Review.
-
Structural overview on the allosteric activation of cyclic AMP receptor protein.Biochim Biophys Acta. 2009 Sep;1794(9):1299-308. doi: 10.1016/j.bbapap.2009.04.015. Epub 2009 May 9. Biochim Biophys Acta. 2009. PMID: 19439203 Review.
References
-
- Monod J, Wyman J, and Changeux JP (1965) On the nature of allosteric transitions: A plausible model. J. Mol. Biol 12, 88–118. - PubMed
-
- Koshland DE, Némethy G, and Filmer D (1966) Comparison of experimental binding data and theoretical models in proteins containing subunits. Biochemistry 5, 365–385. - PubMed
Publication types
MeSH terms
Substances
Grants and funding
LinkOut - more resources
Full Text Sources
Molecular Biology Databases
Research Materials
Miscellaneous
