. 2020 Jan 31;295(5):1411-1425.
doi: 10.1074/jbc.RA119.009807. Epub 2019 Dec 27.

Loss of the disease-associated glycosyltransferase Galnt3 alters Muc10 glycosylation and the composition of the oral microbiome

Affiliations

Loss of the disease-associated glycosyltransferase Galnt3 alters Muc10 glycosylation and the composition of the oral microbiome

Gabriella Peluso et al. J Biol Chem. .

Abstract

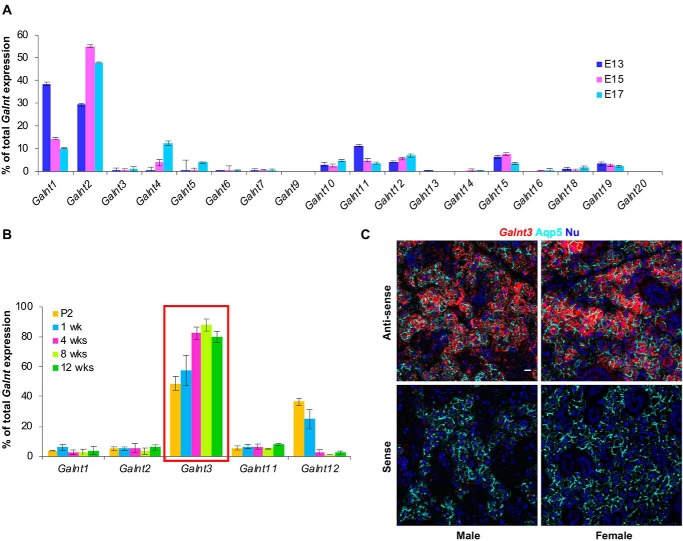
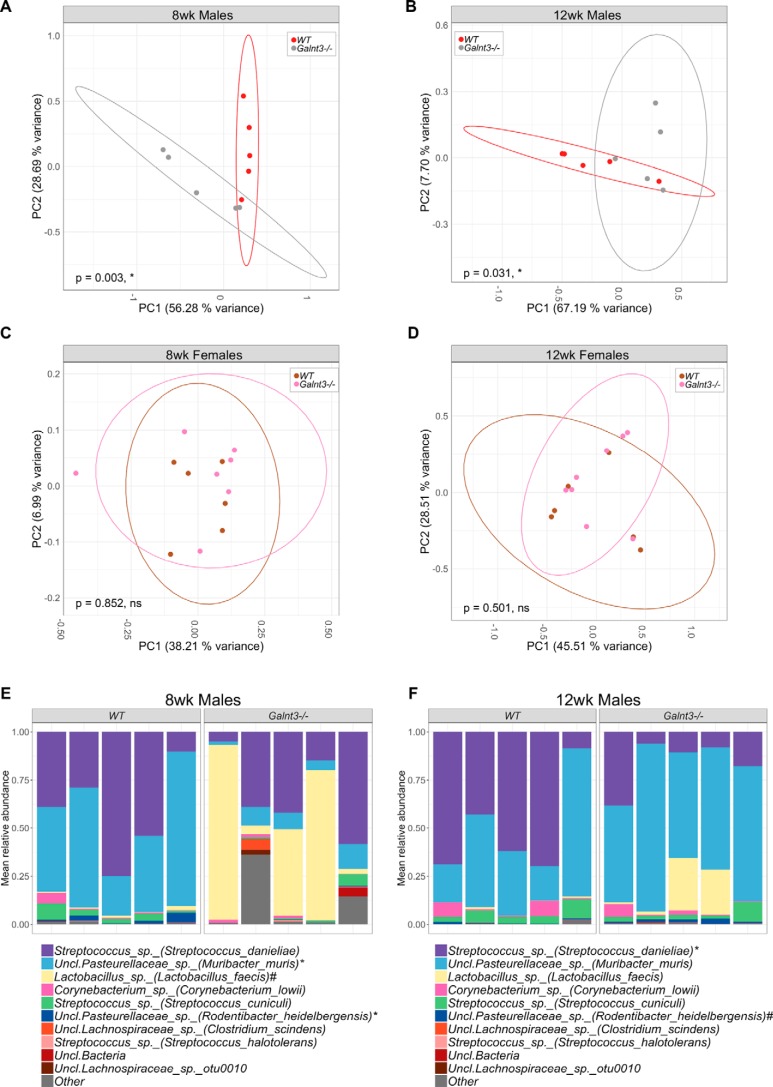
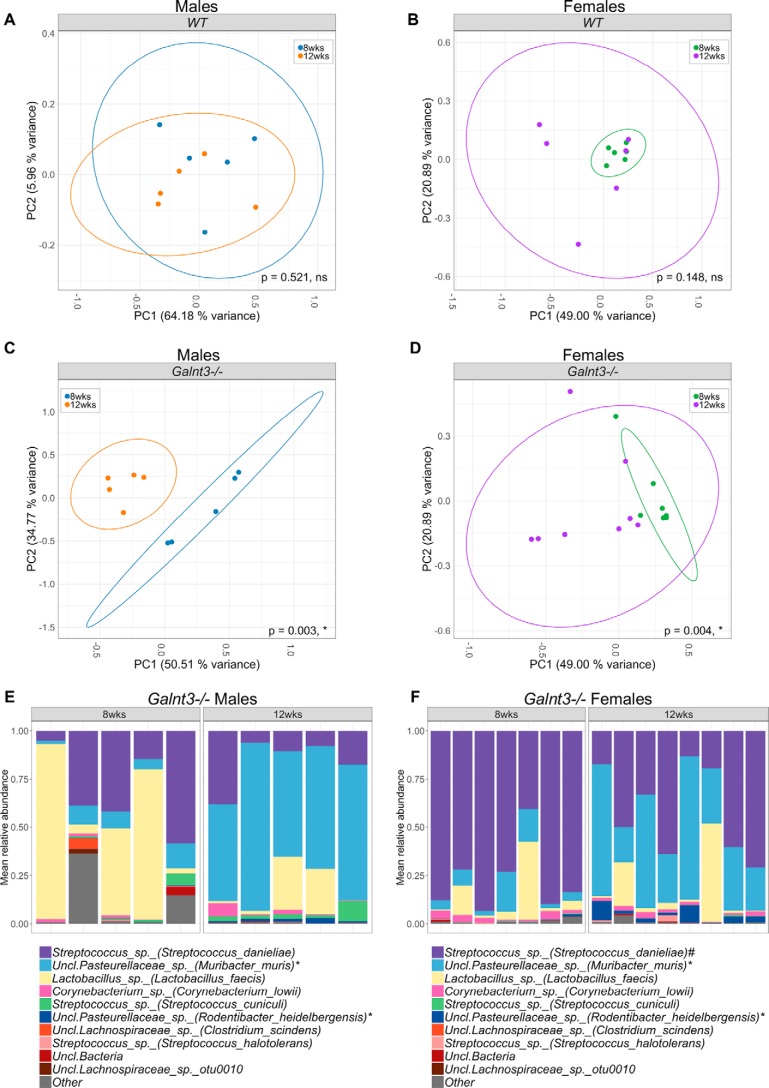
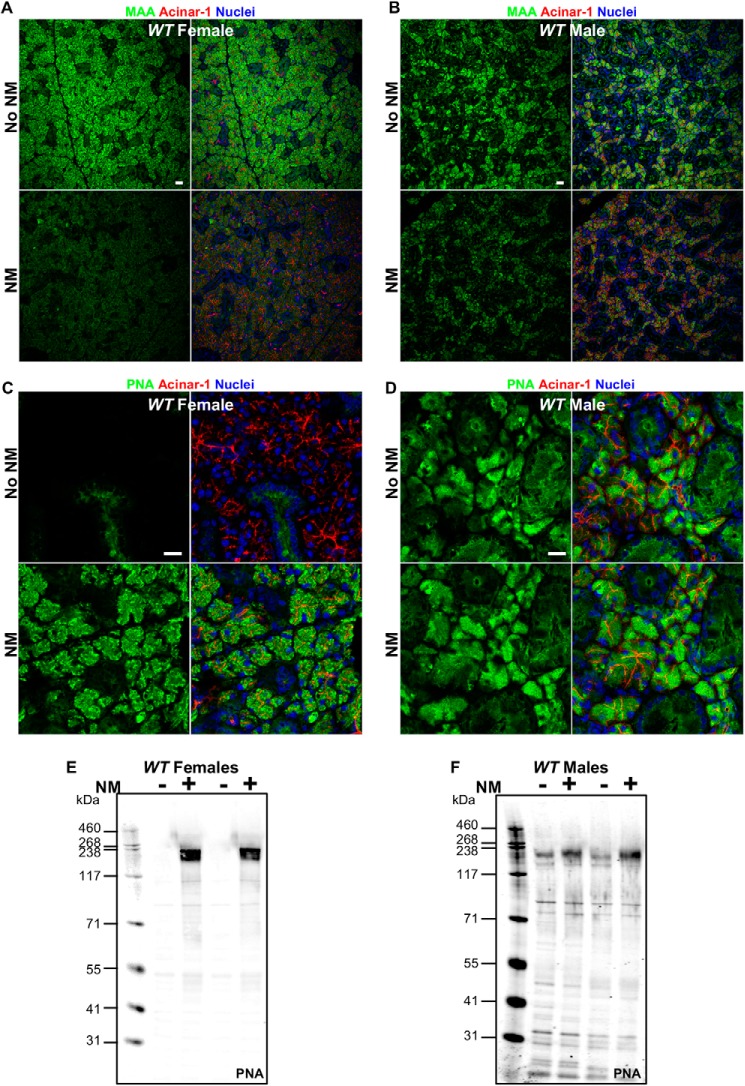
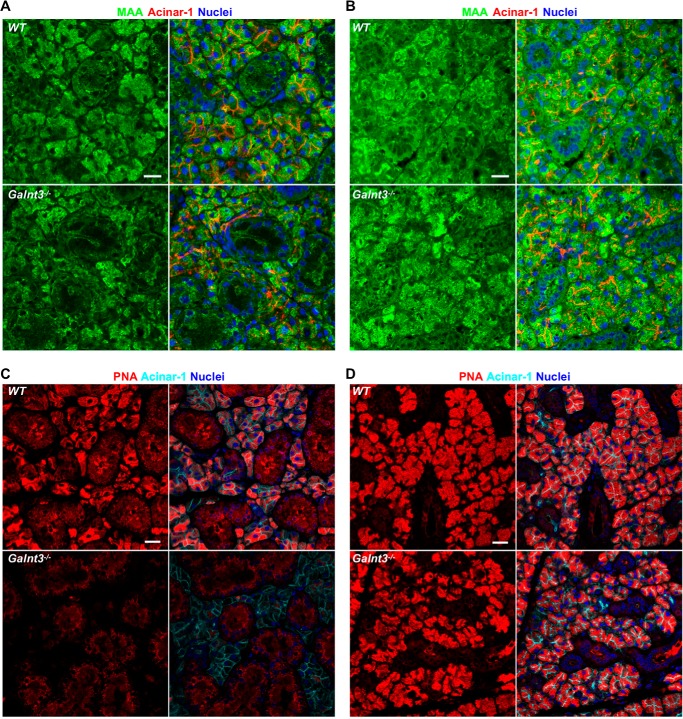
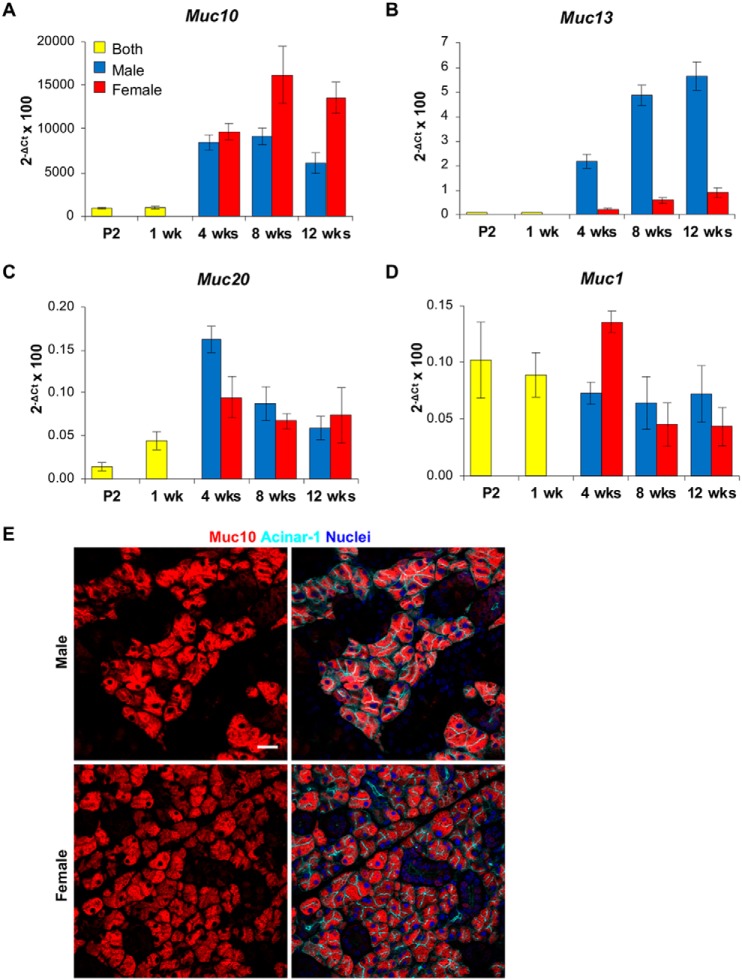
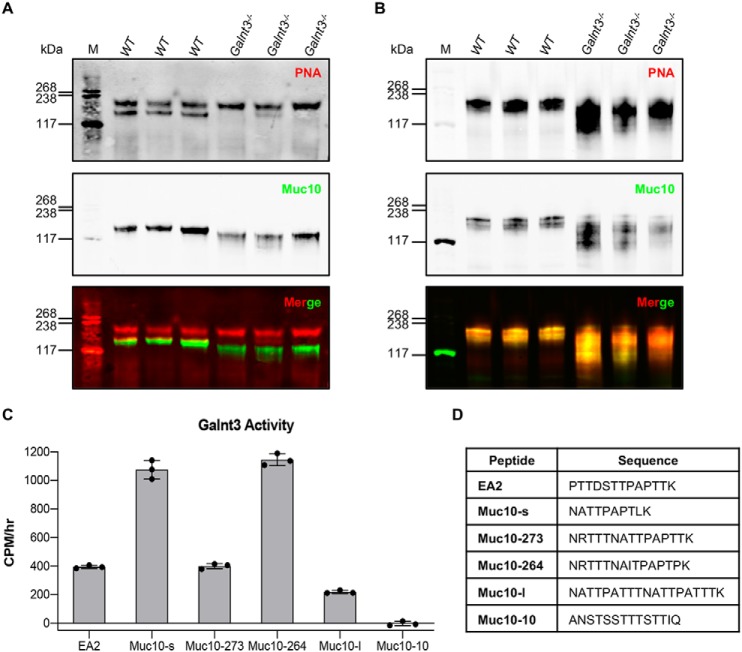
The importance of the microbiome in health and its disruption in disease is continuing to be elucidated. However, the multitude of host and environmental factors that influence the microbiome are still largely unknown. Here, we examined UDP-GalNAc:polypeptide N-acetylgalactosaminyltransferase 3 (Galnt3)-deficient mice, which serve as a model for the disease hyperphosphatemic familial tumoral calcinosis (HFTC). In HFTC, loss of GALNT3 activity in the bone is thought to lead to altered glycosylation of the phosphate-regulating hormone fibroblast growth factor 23 (FGF23), resulting in hyperphosphatemia and subdermal calcified tumors. However, GALNT3 is expressed in other tissues in addition to bone, suggesting that systemic loss could result in other pathologies. Using semiquantitative real-time PCR, we found that Galnt3 is the major O-glycosyltransferase expressed in the secretory cells of salivary glands. Additionally, 16S rRNA gene sequencing revealed that the loss of Galnt3 resulted in changes in the structure, composition, and stability of the oral microbiome. Moreover, we identified the major secreted salivary mucin, Muc10, as an in vivo substrate of Galnt3. Given that mucins and their O-glycans are known to interact with various microbes, our results suggest that loss of Galnt3 decreases glycosylation of Muc10, which alters the composition and stability of the oral microbiome. Considering that oral findings have been documented in HFTC patients, our study suggests that investigating GALNT3-mediated changes in the oral microbiome may be warranted.

Keywords: Galnt3; Muc10; O-glycosylation; bone; glycan; glycosylation; glycosyltransferase; hyperphosphatemic familial tumoral calcinosis (HFTC); microbiome; mucin; post-translational modification; saliva; salivary protein; submandibular gland.


Conflict of interest statement

The authors declare that they have no conflicts of interest with the contents of this article

Figures

Figure 1.
Figure 1.
Galnt3 is the most abundantly expressed isoform in adult SMGs. A, expression of Galnt family members in embryonic SMGs detected by qPCR. Galnt1 is the predominant isoform at E13, and Galnt2 is the predominant isoform at E15 and E17. B, expression of Galnt family members (with greater than 2% relative expression) in early postnatal and adult SMGs. Expression of entire murine Galnt family is shown in Fig. S1A. Galnt3 is the most abundant isoform in adult SMGs. Values represent mean ± S.D. (error bars) from three or more animals. Expression was normalized to 29S rRNA and is represented as percentage of total Galnt expression for each individual stage of development. C, in situ hybridization using TSA in combination with immunofluorescent staining of 8-week SMGs shows that Galnt3 mRNA (red) is found specifically in acinar cells (detected by Aqp5, cyan) in both males and females. Nuclear staining is shown in blue. Scale bar, 10 μm.
Figure 2.
Figure 2.
Loss of Galnt3 alters the oral microbiome. Shown are PCoA plots of oral swab samples based on θ YC distances (to analyze microbial community structure) with 95% confidence ellipses. The oral microbiome was sampled at both 8 and 12 weeks for each individual animal. For both 8-week-old (A) and 12-week-old (B) males, WT samples (red dots) cluster apart from Galnt3−/− samples (gray dots). Each dot represents an individual mouse. At both 8 and 12 weeks of age, statistically significant differences between WT and Galnt3−/− samples were determined by AMOVA (p < 0.05). For females, no significant differences between WT (brown dots) and Galnt3−/− (pink dots) samples were observed at 8 weeks (C) or 12 weeks of age (D). Shown is the relative abundance of bacterial taxa at genus level in oral swab samples from 8-week-old (E) and 12-week-old (F) males. Each bar represents one mouse. Unclassified genera are shown at the family level. Species level taxonomy is reported in parenthesis when >97% similarity was achieved using NCBI BLAST. *, species overrepresented in WT samples; #, species overrepresented in Galnt3−/− samples according to LEfSe analyses.
Figure 3.
Figure 3.
Loss of Galnt3 alters stability of the oral microbiome over time. Shown are PCoA plots comparing 8- and 12-week oral swab samples based on θ YC distances (to analyze microbial community structure) with 95% confidence ellipses. The oral microbiome was sampled at both 8 and 12 weeks for each individual animal. For both WT males (A) and females (B), no significant differences between 8- and 12-week samples were observed. For Galnt3−/− animals, 8-week samples cluster apart from 12-week samples for both males (C) and females (D). Statistically significant differences between 8- and 12-week Galnt3−/− samples were determined by AMOVA (p < 0.05). Shown is the relative abundance of bacterial taxa at the genus level in oral swab samples from male (E) and female (F) Galnt3−/− animals. Each bar represents one mouse. Unclassified genera are shown at the family level. Species-level taxonomy is reported in parenthesis when >97% similarity was achieved using NCBI BLAST. *, species overrepresented in 12-week samples; #, species overrepresented in 8-week samples according to LEfSe analyses.
Figure 4.
Figure 4.
Glycans present within the acinar cells of SMGs. Immunofluorescent staining of 8-week WT female (A) and male (B) SMGs with the lectin MAA (green), which detects α2,3-linked sialic acid on O- and N-linked glycans. Samples were either untreated (No NM) or treated with neuraminidase (NM), which removes sialic acid to show specificity. Acinar cells are shown with the marker acinar-1 (red). Nuclei are shown in blue. Scale bars, 20 μm. Shown is immunofluorescent staining of 8-week WT female (C) and male (D) SMGs with the lectin PNA (green), which detects the nonsialylated core 1 O-glycan Galβ1,3GalNAc. Samples were either untreated (No NM) or treated with neuraminidase (NM). No PNA staining is seen in untreated female SMGs, whereas PNA staining is seen in both treated and untreated male SMGs. Acinar cells are shown with the marker acinar-1 (red). Nuclei are shown in blue. Scale bars, 10 μm. Shown are western blots of WT female (E) and male (F) SMG extracts either untreated (−) or treated with NM (+) and probed with PNA. Molecular mass markers (kDa) are shown to the left of each blot.
Figure 5.
Figure 5.
Loss of Galnt3 results in diminished O-glycans in male acinar cells. Immunofluorescent staining of 8-week WT and Galnt3−/− male (A) and female (B) SMGs with the lectin MAA (green), which detects α2,3-linked sialic acid on O- and N-linked glycans. Acinar cells are shown with the marker acinar-1 (red). Nuclei are shown in blue. Scale bars, 10 μm. C, immunofluorescent staining of 8-week male SMGs shows a dramatic reduction in O-glycans (detected by PNA, red) specifically in the acinar cells (detected by acinar-1, cyan) of Galnt3−/− SMGs as compared with WT. D, immunofluorescent staining of neuraminidase-treated 8-week female SMGs reveals no obvious differences in PNA-reactive O-glycans between WT and Galnt3−/− SMGs. Nuclear staining is shown in blue. Scale bars, 20 μm.
Figure 6.
Figure 6.
Analysis of mucin gene expression in early postnatal and adult SMGs. A, qPCR analysis demonstrates that Muc10 is the most abundantly expressed mucin gene at all five stages, with increasing expression in adult stages. Moderate to low levels of expression were detected for Muc13 (B), Muc20 (C), and Muc1 (D). Muc2, Muc4, Muc5ac, and Muc6 were not detected at any stage. Values represent mean ± S.D. (error bars) from three or more animals. Expression was normalized to 29S rRNA. E, immunofluorescent staining of 8-week SMGs shows specific localization of Muc10 protein (red) to acinar cells (detected by acinar-1, cyan) in both males and females. Nuclear staining is shown in blue. Scale bar, 20 μm.
Figure 7.
Figure 7.
Muc10 is an in vivo substrate for Galnt3. A, western blots of 8-week male SMG lysates probed for O-glycans (detected by PNA, red) and Muc10 (green). Separated channels are shown in black in the top two panels, and merged channels are shown in color in the bottom panel. The lower of the two PNA-reactive bands overlaps with the Muc10 band in WT SMGs. In Galnt3−/− SMGs, the lower PNA-reactive band is absent, and the Muc10 band is smeared and reduced in size. B, western blots of neuraminidase-treated 8-week female SMG lysates probed for O-glycans (detected by PNA, red) and Muc10 (green). The PNA and Muc10 bands overlap in both WT and Galnt3−/− SMGs. In Galnt3−/− SMGs, both the PNA and Muc10 bands exhibit altered mobility as compared with WT. Molecular mass markers (kDa) are shown to the left of each blot. C, in vitro enzymatic activity of Galnt3 against Muc10 acceptor peptides (peptide sequences shown in D). EA2 was used as a positive control. Galnt3 was able to glycosylate the Muc10-s, Muc10-273, Muc10-264, and Muc10-l peptides. Galnt3 showed no activity toward the Muc10-10 peptide. Each data point represents an individual assay. Error bars, S.D.

Similar articles

Cited by

References

    1. Kamada N., Chen G. Y., Inohara N., and Núñez G. (2013) Control of pathogens and pathobionts by the gut microbiota. Nat. Immunol. 14, 685–690 10.1038/ni.2608 - DOI - PMC - PubMed
    1. Lamont R. J., Koo H., and Hajishengallis G. (2018) The oral microbiota: dynamic communities and host interactions. Nat. Rev. Microbiol. 16, 745–759 10.1038/s41579-018-0089-x - DOI - PMC - PubMed
    1. Huttenhower C., Kostic A. D., and Xavier R. J. (2014) Inflammatory bowel disease as a model for translating the microbiome. Immunity 40, 843–854 10.1016/j.immuni.2014.05.013 - DOI - PMC - PubMed
    1. Lamont R. J., and Hajishengallis G. (2015) Polymicrobial synergy and dysbiosis in inflammatory disease. Trends Mol. Med. 21, 172–183 10.1016/j.molmed.2014.11.004 - DOI - PMC - PubMed
    1. Abusleme L., Dupuy A. K., Dutzan N., Silva N., Burleson J. A., Strausbaugh L. D., Gamonal J., and Diaz P. I. (2013) The subgingival microbiome in health and periodontitis and its relationship with community biomass and inflammation. ISME J. 7, 1016–1025 10.1038/ismej.2012.174 - DOI - PMC - PubMed

Publication types

MeSH terms

Supplementary concepts