

The Role of Efflux Pumps and Environmental pH in Bacterial Multidrug Resistance
- PMID: 31882464
- PMCID: PMC6984089
- DOI: 10.21873/invivo.11746
The Role of Efflux Pumps and Environmental pH in Bacterial Multidrug Resistance
Abstract
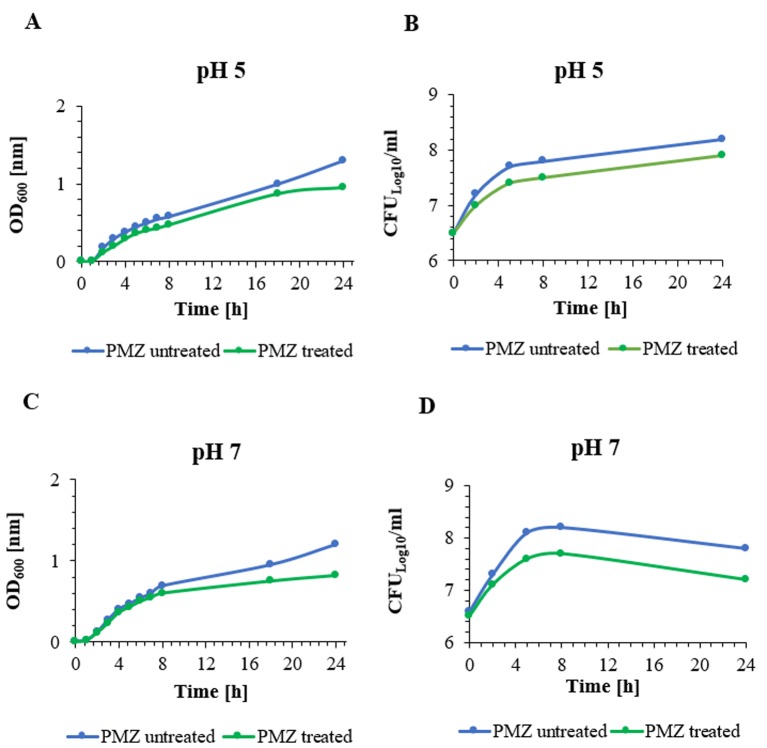
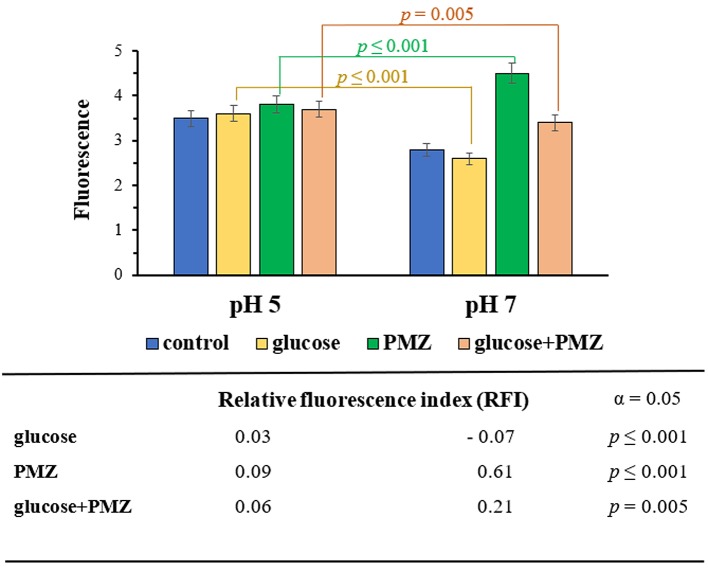
Background/aim: One of the most studied bacterial resistance mechanisms is the resistance related to multidrug efflux pumps. In our study the pump activity of the Escherichia coli K-12 AG100 strain expressing the AcrAB-TolC pump system was investigated at pH 7 and pH 5 in the presence of the efflux pump inhibitor (EPI) promethazine (PMZ).
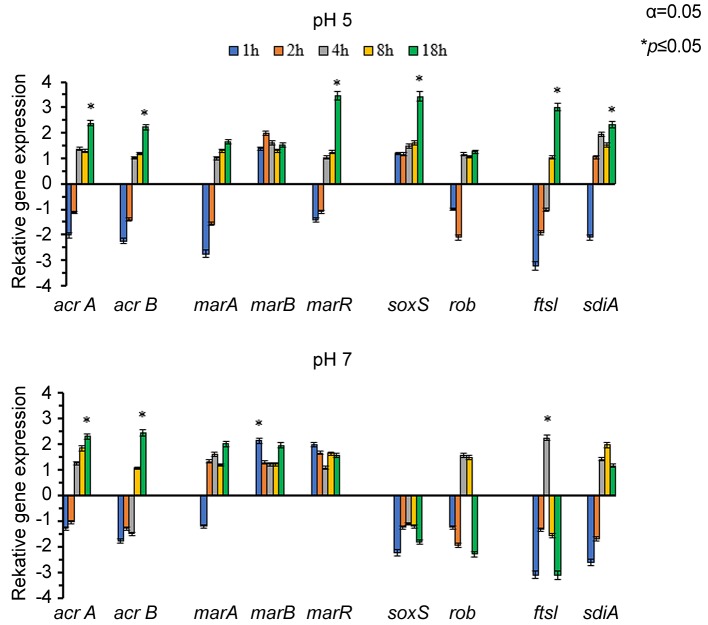
Materials and methods: The EPI activity was assessed by real-time fluorimetry. The influence of PMZ treatment on the relative expression of the pump genes acrA, acrB and their regulators marA, marB, marR, the stress genes soxS, rob, as well as the bacterial growth control genes ftsI, and sdiA were determined by RT-qPCR.
Results: The EPI activity of PMZ was more effective at neutral pH. The PMZ treatment induced a significant stress response in the bacterium at acidic pH by the up-regulation of genes.
Conclusion: The genetic system that regulates the activity of the main efflux pump is pH-dependent.
Keywords: Escherichia coli K-12 AG100; Multidrug resistance; efflux pump; efflux pump genes; pH-dependent; promethazine.
Copyright© 2020, International Institute of Anticancer Research (Dr. George J. Delinasios), All rights reserved.
Conflict of interest statement
None declared.
Figures
Similar articles
-
Fluorinated Beta-diketo Phosphorus Ylides Are Novel Efflux Pump Inhibitors in Bacteria.In Vivo. 2016 11-12;30(6):813-817. doi: 10.21873/invivo.10999. In Vivo. 2016. PMID: 27815466
-
Extreme Acid Modulates Fitness Trade-Offs of Multidrug Efflux Pumps MdtEF-TolC and AcrAB-TolC in Escherichia coli K-12.Appl Environ Microbiol. 2021 Jul 27;87(16):e0072421. doi: 10.1128/AEM.00724-21. Epub 2021 Jul 27. Appl Environ Microbiol. 2021. PMID: 34085861 Free PMC article.
-
Upregulation of AcrEF in Quinolone Resistance Development in Escherichia coli When AcrAB-TolC Function Is Impaired.Microb Drug Resist. 2018 Jan/Feb;24(1):18-23. doi: 10.1089/mdr.2016.0207. Epub 2017 May 18. Microb Drug Resist. 2018. PMID: 28520511
-
[The role of cell wall organization and active efflux pump systems in multidrug resistance of bacteria].Mikrobiyol Bul. 2007 Apr;41(2):309-27. Mikrobiyol Bul. 2007. PMID: 17682720 Review. Turkish.
-
Improvement of organic solvent tolerance level of Escherichia coli by overexpression of stress-responsive genes.Extremophiles. 1998 Aug;2(3):239-48. doi: 10.1007/s007920050066. Extremophiles. 1998. PMID: 9783171 Review.
Cited by
-
Estimating the optimal efflux inhibitor concentration of carvacrol as a function of the bacterial physiological state.Front Microbiol. 2023 Jan 25;14:1073798. doi: 10.3389/fmicb.2023.1073798. eCollection 2023. Front Microbiol. 2023. PMID: 36760502 Free PMC article.
-
Maximum levels of cross-contamination for 24 antimicrobial active substances in non-target feed. Part 1: Methodology, general data gaps and uncertainties.EFSA J. 2021 Oct 26;19(10):e06852. doi: 10.2903/j.efsa.2021.6852. eCollection 2021 Oct. EFSA J. 2021. PMID: 34729081 Free PMC article.
-
Genetic- and Fiber-Diet-Mediated Changes in Antibiotic Resistance Genes in Pig Colon Contents and Feces and Their Driving Factors.Microorganisms. 2023 Sep 22;11(10):2370. doi: 10.3390/microorganisms11102370. Microorganisms. 2023. PMID: 37894028 Free PMC article.
-
Repurposing Antidepressants and Phenothiazine Antipsychotics as Efflux Pump Inhibitors in Cancer and Infectious Diseases.Antibiotics (Basel). 2023 Jan 10;12(1):137. doi: 10.3390/antibiotics12010137. Antibiotics (Basel). 2023. PMID: 36671340 Free PMC article. Review.
-
Bacterial Stress Responses as Potential Targets in Overcoming Antibiotic Resistance.Microorganisms. 2022 Jul 9;10(7):1385. doi: 10.3390/microorganisms10071385. Microorganisms. 2022. PMID: 35889104 Free PMC article. Review.
References
-
- Weston N, Sharma P, Ricci V, Piddock LJV. Regulation of the AcrAB-TolC efflux pump in Enterobacteriaceae. Res Microbiol. 2018;169(7-8):425–431. PMID: 29128373. DOI: 10.1016/j.resmic.2017.10.005. - PubMed
-
- Sun J, Deng Z, Yan A. Bacterial multidrug efflux pumps: Mechanisms, physiology and pharmacological exploitations. Biochem Biophys Res Commun. 2014;453(2):254–267. PMID: 24878531. DOI: 10.1016/j.bbrc.2014.05.090. - PubMed
-
- Pos KM. Drug transport mechanism of the AcrB efflux pump. Biochim Biophys Acta. 2009;1794(5):782–793. PMID: 19166984. DOI: 10.1016/j.bbapap.2008.12.015. - PubMed
MeSH terms
Substances
LinkOut - more resources
Full Text Sources