

Helicase Lymphoid-Specific Enzyme Contributes to the Maintenance of Methylation of SST1 Pericentromeric Repeats That Are Frequently Demethylated in Colon Cancer and Associate with Genomic Damage
- PMID: 31867127
- PMCID: PMC6924650
- DOI: 10.3390/epigenomes1010002
Helicase Lymphoid-Specific Enzyme Contributes to the Maintenance of Methylation of SST1 Pericentromeric Repeats That Are Frequently Demethylated in Colon Cancer and Associate with Genomic Damage
Abstract
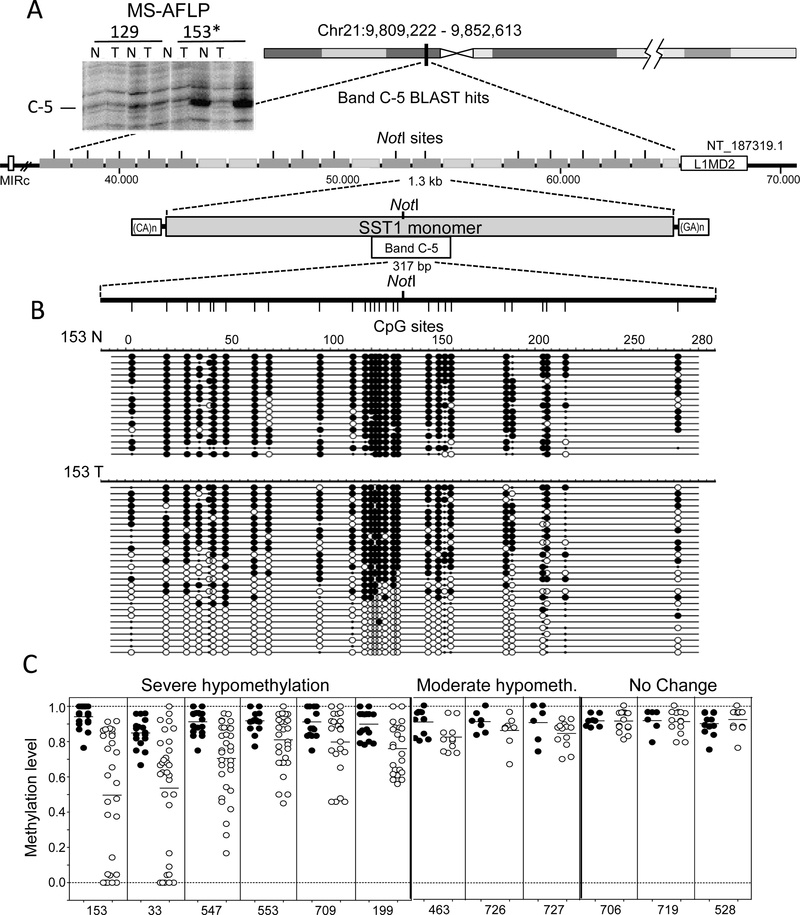
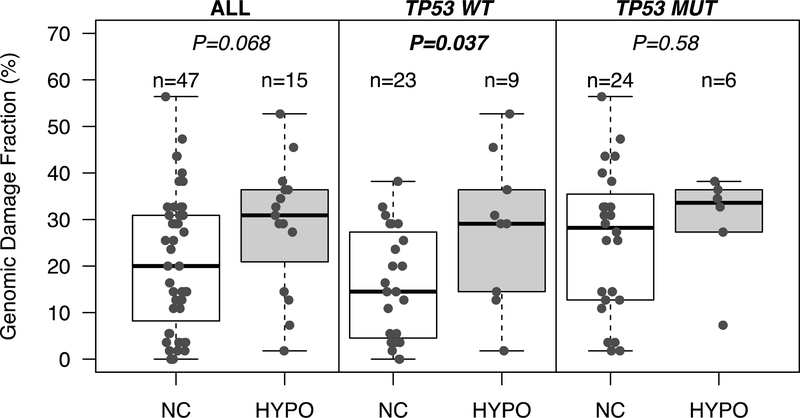
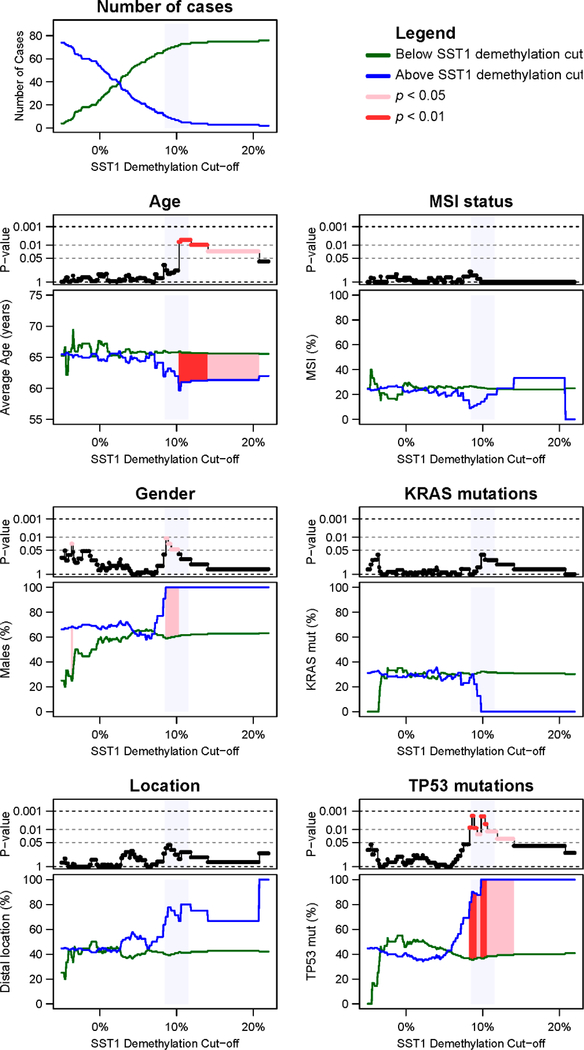
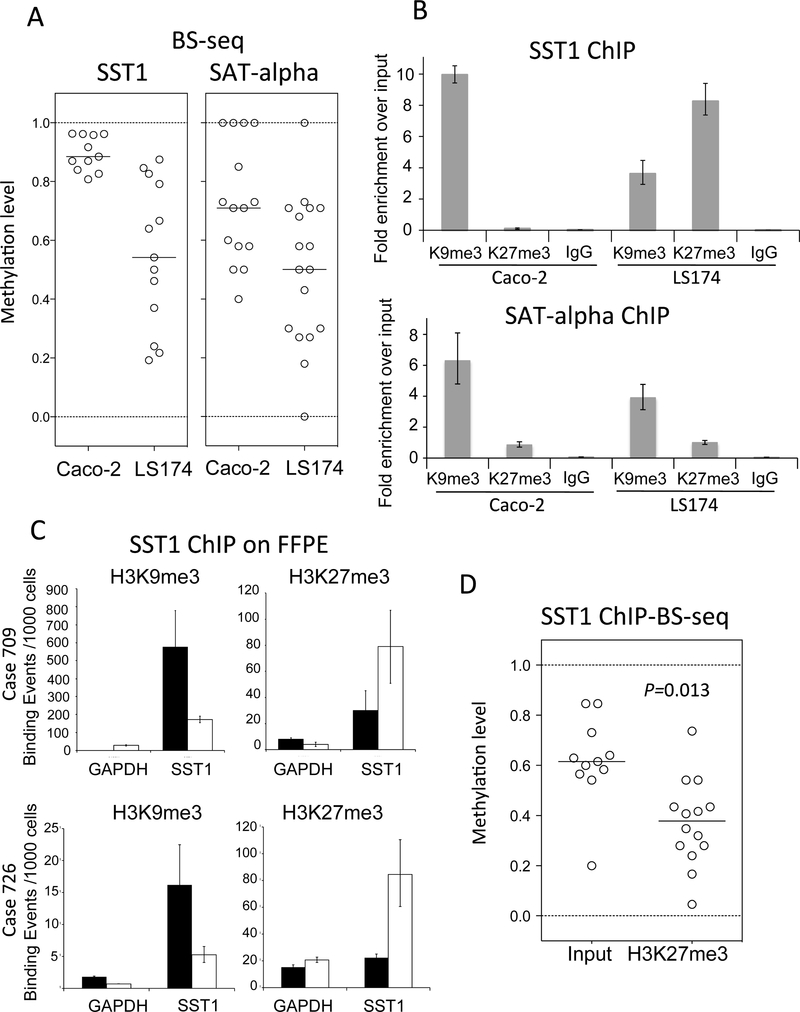
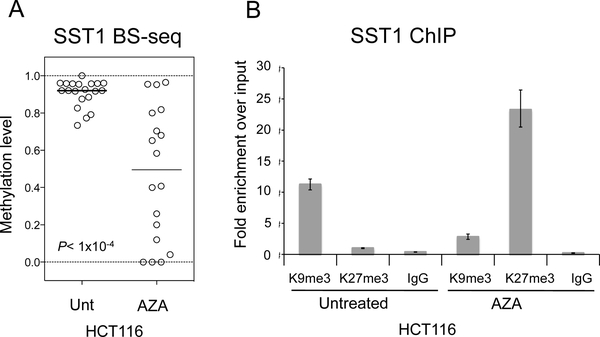
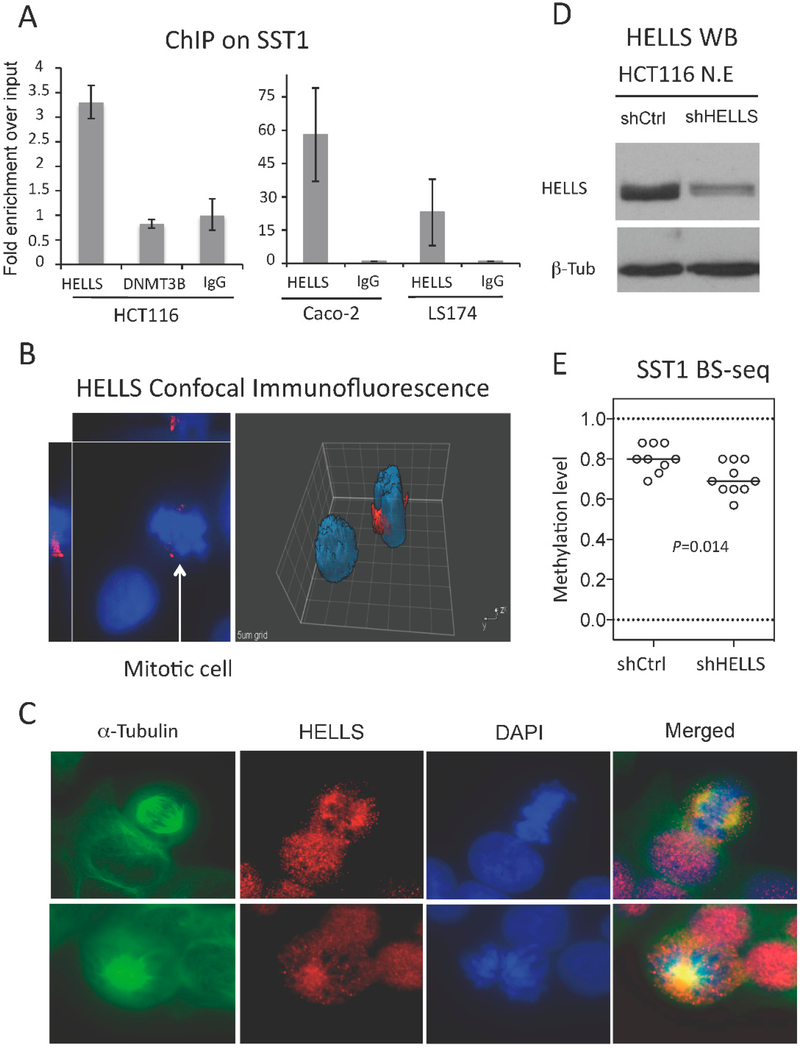
DNA hypomethylation at repetitive elements accounts for the genome-wide DNA hypomethylation common in cancer, including colorectal cancer (CRC). We identified a pericentromeric repeat element called SST1 frequently hypomethylated (>5% demethylation compared with matched normal tissue) in several cancers, including 28 of 128 (22%) CRCs. SST1 somatic demethylation associated with genome damage, especially in tumors with wild-type TP53. Seven percent of the 128 CRCs exhibited a higher ("severe") level of demethylation (≥10%) that co-occurred with TP53 mutations. SST1 demethylation correlated with distinct histone marks in CRC cell lines and primary tumors: demethylated SST1 associated with high levels of the repressive histone 3 lysine 27 trimethylation (H3K27me3) mark and lower levels of histone 3 lysine 9 trimethylation (H3K9me3). Furthermore, induced demethylation of SST1 by 5-aza-dC led to increased H3K27me3 and reduced H3K9me3. Thus, in some CRCs, SST1 demethylation reflects an epigenetic reprogramming associated with changes in chromatin structure that may affect chromosomal integrity. The chromatin remodeler factor, the helicase lymphoid-specific (HELLS) enzyme, called the "epigenetic guardian of repetitive elements", interacted with SST1 as shown by chromatin immunoprecipitation, and down-regulation of HELLS by shRNA resulted in demethylation of SST1 in vitro. Altogether these results suggest that HELLS contributes to SST1 methylation maintenance. Alterations in HELLS recruitment and function could contribute to the somatic demethylation of SST1 repeat elements undergone before and/or during CRC pathogenesis.
Keywords: DNA demethylation; colorectal cancer; epigenetics; satellite element.
Conflict of interest statement
Conflicts of Interest: The authors declare that they have no conflicts of interest.
Figures
Similar articles
-
Somatic Hypomethylation of Pericentromeric SST1 Repeats and Tetraploidization in Human Colorectal Cancer Cells.Cancers (Basel). 2021 Oct 26;13(21):5353. doi: 10.3390/cancers13215353. Cancers (Basel). 2021. PMID: 34771515 Free PMC article.
-
Histone chaperone CAF-1 mediates repressive histone modifications to protect preimplantation mouse embryos from endogenous retrotransposons.Proc Natl Acad Sci U S A. 2015 Nov 24;112(47):14641-6. doi: 10.1073/pnas.1512775112. Epub 2015 Nov 6. Proc Natl Acad Sci U S A. 2015. PMID: 26546670 Free PMC article.
-
The Chromatin Remodeler HELLS: A New Regulator in DNA Repair, Genome Maintenance, and Cancer.Int J Mol Sci. 2022 Aug 18;23(16):9313. doi: 10.3390/ijms23169313. Int J Mol Sci. 2022. PMID: 36012581 Free PMC article. Review.
-
Chicken embryonic stem cells and primordial germ cells display different heterochromatic histone marks than their mammalian counterparts.Epigenetics Chromatin. 2016 Feb 10;9:5. doi: 10.1186/s13072-016-0056-6. eCollection 2016. Epigenetics Chromatin. 2016. PMID: 26865862 Free PMC article.
-
Dynamics of H3K27me3 methylation and demethylation in plant development.Plant Signal Behav. 2015;10(9):e1027851. doi: 10.1080/15592324.2015.1027851. Plant Signal Behav. 2015. PMID: 26313233 Free PMC article. Review.
Cited by
-
Integrated Bioinformatics Analysis to Identify Abnormal Methylated Differentially Expressed Genes for Predicting Prognosis of Human Colon Cancer.Int J Gen Med. 2021 Aug 24;14:4745-4756. doi: 10.2147/IJGM.S324483. eCollection 2021. Int J Gen Med. 2021. PMID: 34466019 Free PMC article.
-
Leader gene identification for digestive system cancers based on human subcellular location and cancer-related characteristics in protein-protein interaction networks.Front Genet. 2022 Sep 26;13:919210. doi: 10.3389/fgene.2022.919210. eCollection 2022. Front Genet. 2022. PMID: 36226184 Free PMC article.
-
Polyploidy-associated paramutation in Arabidopsis is determined by small RNAs, temperature, and allele structure.PLoS Genet. 2021 Mar 9;17(3):e1009444. doi: 10.1371/journal.pgen.1009444. eCollection 2021 Mar. PLoS Genet. 2021. PMID: 33690630 Free PMC article.
-
From telomere to telomere: The transcriptional and epigenetic state of human repeat elements.Science. 2022 Apr;376(6588):eabk3112. doi: 10.1126/science.abk3112. Epub 2022 Apr 1. Science. 2022. PMID: 35357925 Free PMC article.
-
Somatic Hypomethylation of Pericentromeric SST1 Repeats and Tetraploidization in Human Colorectal Cancer Cells.Cancers (Basel). 2021 Oct 26;13(21):5353. doi: 10.3390/cancers13215353. Cancers (Basel). 2021. PMID: 34771515 Free PMC article.
References
-
- Baylin SB; Ohm JE Epigenetic gene silencing in cancer—A mechanism for early oncogenic pathway addiction? Nat. Rev. Cancer 2006, 6, 107–116. - PubMed
-
- Esteller M Epigenetics in cancer. N. Engl. J. Med. 2008, 358, 1148–1159. - PubMed
-
- Feinberg AP; Tycko B The history of cancer epigenetics. Nat. Rev. Cancer 2004, 4, 143–153. - PubMed
-
- Feinberg AP; Ohlsson R; Henikoff S The epigenetic progenitor origin of human cancer. Nat. Rev. Cancer 2006, 7, 21–33. - PubMed
-
- Eden A; Gaudet F; Waghmare A; Jaenisch R Chromosomal instability and tumors promoted by DNA hypomethylation. Science 2003, 300, 455. - PubMed
Grants and funding
LinkOut - more resources
Full Text Sources
Research Materials
Miscellaneous
