Lipid accumulation and oxidation in glioblastoma multiforme
- PMID: 31863022
- PMCID: PMC6925201
- DOI: 10.1038/s41598-019-55985-z
Lipid accumulation and oxidation in glioblastoma multiforme
Abstract
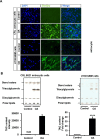
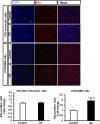
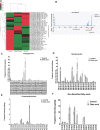
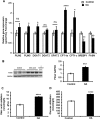
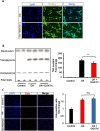
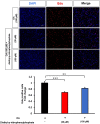
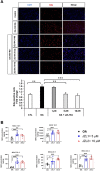
Glioblastoma multiforme (GBM) is the most common and lethal primary malignant brain tumor in adults. Despite the multimodal standard treatments for GBM, the median survival is still about one year. Analysis of brain tissues from GBM patients shows that lipid droplets are highly enriched in tumor tissues while undetectable in normal brain tissues, yet the identity and functions of lipid species in GBM are not well understood. The aims of the present work are to determine how GBM utilizes fatty acids, and assess their roles in GBM proliferation. Treatment of U138 GBM cells with a monounsaturated fatty acid, oleic acid, induces accumulation of perilipin 2-coated lipid droplets containing triglycerides enriched in C18:1 fatty acid, and increases fatty acid oxidation. Interestingly, oleic acid also increases glucose utilization and proliferation of GBM cells. In contrast, pharmacologic inhibition of monoacylglycerol lipase attenuates GBM proliferation. Our findings demonstrate that monounsaturated fatty acids promote GBM proliferation via triglyceride metabolism, suggesting a novel lipid droplet-mediated pathway which may be targeted for GBM treatment.
Conflict of interest statement
The authors declare no competing interests.
Figures
Similar articles
-
Metabolic Contrasts: Fatty Acid Oxidation and Ketone Bodies in Healthy Brains vs. Glioblastoma Multiforme.Int J Mol Sci. 2024 May 17;25(10):5482. doi: 10.3390/ijms25105482. Int J Mol Sci. 2024. PMID: 38791520 Free PMC article. Review.
-
Valproic acid inhibits glioblastoma multiforme cell growth via paraoxonase 2 expression.Oncotarget. 2017 Feb 28;8(9):14666-14679. doi: 10.18632/oncotarget.14716. Oncotarget. 2017. PMID: 28108734 Free PMC article.
-
The HIF1α-PDGFD-PDGFRα axis controls glioblastoma growth at normoxia/mild-hypoxia and confers sensitivity to targeted therapy by echinomycin.J Exp Clin Cancer Res. 2021 Sep 1;40(1):278. doi: 10.1186/s13046-021-02082-7. J Exp Clin Cancer Res. 2021. PMID: 34470658 Free PMC article.
-
γ-Glutamyl transferase 7 is a novel regulator of glioblastoma growth.BMC Cancer. 2015 Apr 7;15:225. doi: 10.1186/s12885-015-1232-y. BMC Cancer. 2015. PMID: 25884624 Free PMC article.
-
Natural flavonoids alleviate glioblastoma multiforme by regulating long non-coding RNA.Biomed Pharmacother. 2023 May;161:114477. doi: 10.1016/j.biopha.2023.114477. Epub 2023 Mar 15. Biomed Pharmacother. 2023. PMID: 36931030 Review.
Cited by
-
Microenvironmental Factors Modulating Tumor Lipid Metabolism: Paving the Way to Better Antitumoral Therapy.Front Oncol. 2021 Nov 23;11:777273. doi: 10.3389/fonc.2021.777273. eCollection 2021. Front Oncol. 2021. PMID: 34888248 Free PMC article. Review.
-
Metabolic Rewiring in Glioblastoma Cancer: EGFR, IDH and Beyond.Front Oncol. 2022 Jul 14;12:901951. doi: 10.3389/fonc.2022.901951. eCollection 2022. Front Oncol. 2022. PMID: 35912242 Free PMC article. Review.
-
Metabolic signatures associated with oncolytic myxoma viral infections.Sci Rep. 2022 Jul 23;12(1):12599. doi: 10.1038/s41598-022-15562-3. Sci Rep. 2022. PMID: 35871072 Free PMC article.
-
Sphingolipid Signaling and Complement Activation in Glioblastoma: A Promising Avenue for Therapeutic Intervention.Biochem (Basel). 2024 Jun;4(2):126-143. doi: 10.3390/biochem4020007. Epub 2024 Jun 6. Biochem (Basel). 2024. PMID: 38894892 Free PMC article.
-
Metabolic Reprogramming in Glioblastoma Multiforme: A Review of Pathways and Therapeutic Targets.Cells. 2024 Sep 19;13(18):1574. doi: 10.3390/cells13181574. Cells. 2024. PMID: 39329757 Free PMC article. Review.
References
-
- M, p. Current concepts and management of glioblastoma (2011). - PubMed
Publication types
MeSH terms
Substances
LinkOut - more resources
Full Text Sources
Medical
Research Materials

