Interactions between Soluble Species of β-Amyloid and α-Synuclein Promote Oligomerization while Inhibiting Fibrillization
- PMID: 31854188
- PMCID: PMC7269195
- DOI: 10.1021/acs.biochem.9b00655
Interactions between Soluble Species of β-Amyloid and α-Synuclein Promote Oligomerization while Inhibiting Fibrillization
Abstract
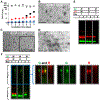
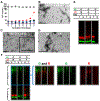
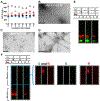
Aggregations of β-amyloid (Aβ) and α-synuclein (αS) into oligomeric and fibrillar assemblies are the pathological hallmarks of Alzheimer's and Parkinson's diseases, respectively. Although Aβ and αS affect different regions of the brain and are separated at the cellular level, there is evidence of their eventual interaction in the pathology of both disorders. Characterization of interactions of Aβ and αS at various stages of their aggregation pathways could reveal mechanisms and therapeutic targets for the prevention and cure of these neurodegenerative diseases. In this study, we comprehensively examined the interactions and their molecular manifestations using an array of characterization tools. We show for the first time that αS monomers and oligomers, but not αS fibrils, inhibit Aβ fibrillization while promoting oligomerization of Aβ monomers and stabilizing preformed Aβ oligomers via coassembly, as judged by Thioflavin T fluorescence, transmission electron microscopy, and SDS- and native-PAGE with fluorescently labeled peptides/proteins. In contrast, soluble Aβ species, such as monomers and oligomers, aggregate into fibrils, when incubated alone under the otherwise same condition. Our study provides evidence that the interactions with αS soluble species, responsible for the effects, are mediated primarily by the C-terminus of Aβ, when judged by competitive immunoassays using antibodies recognizing various fragments of Aβ. We also show that the C-terminus of Aβ is a primary site for its interaction with αS fibrils. Collectively, these data demonstrate aggregation state-specific interactions between αS and Aβ and offer insight into a molecular basis of synergistic biological effects between the two polypeptides.
Figures


Similar articles
-
α-synuclein-assisted oligomerization of β-amyloid (1-42).Arch Biochem Biophys. 2022 Mar 15;717:109120. doi: 10.1016/j.abb.2022.109120. Epub 2022 Jan 15. Arch Biochem Biophys. 2022. PMID: 35041853 Free PMC article.
-
Influence of the β-sheet content on the mechanical properties of aggregates during amyloid fibrillization.Angew Chem Int Ed Engl. 2015 Feb 16;54(8):2462-6. doi: 10.1002/anie.201409050. Epub 2015 Jan 14. Angew Chem Int Ed Engl. 2015. PMID: 25588987
-
A KLVFFAE-Derived Peptide Probe for Detection of Alpha-Synuclein Fibrils.Appl Biochem Biotechnol. 2020 Apr;190(4):1411-1424. doi: 10.1007/s12010-019-03197-6. Epub 2019 Nov 27. Appl Biochem Biotechnol. 2020. PMID: 31776941 Free PMC article.
-
Insights into the Molecular Mechanisms of Alzheimer's and Parkinson's Diseases with Molecular Simulations: Understanding the Roles of Artificial and Pathological Missense Mutations in Intrinsically Disordered Proteins Related to Pathology.Int J Mol Sci. 2018 Jan 24;19(2):336. doi: 10.3390/ijms19020336. Int J Mol Sci. 2018. PMID: 29364151 Free PMC article. Review.
-
Amyloid Oligomers: A Joint Experimental/Computational Perspective on Alzheimer's Disease, Parkinson's Disease, Type II Diabetes, and Amyotrophic Lateral Sclerosis.Chem Rev. 2021 Feb 24;121(4):2545-2647. doi: 10.1021/acs.chemrev.0c01122. Epub 2021 Feb 5. Chem Rev. 2021. PMID: 33543942 Free PMC article. Review.
Cited by
-
Co-aggregation of α-synuclein with amyloid-β stabilizes β-sheet-rich oligomers and enhances the formation of β-barrels.Phys Chem Chem Phys. 2023 Nov 29;25(46):31604-31614. doi: 10.1039/d3cp04138g. Phys Chem Chem Phys. 2023. PMID: 37964757 Free PMC article.
-
Engineering of a protein probe with multiple inputs and multiple outputs for evaluation of alpha synuclein aggregation states.Biochem Eng J. 2022 Jan;178:108292. doi: 10.1016/j.bej.2021.108292. Epub 2021 Nov 29. Biochem Eng J. 2022. PMID: 35002469 Free PMC article.
-
α-synuclein-assisted oligomerization of β-amyloid (1-42).Arch Biochem Biophys. 2022 Mar 15;717:109120. doi: 10.1016/j.abb.2022.109120. Epub 2022 Jan 15. Arch Biochem Biophys. 2022. PMID: 35041853 Free PMC article.
-
α-Synuclein Aggregation Is Triggered by Oligomeric Amyloid-β 42 via Heterogeneous Primary Nucleation.J Am Chem Soc. 2023 Aug 23;145(33):18276-18285. doi: 10.1021/jacs.3c03212. Epub 2023 Aug 9. J Am Chem Soc. 2023. PMID: 37556728 Free PMC article.
-
Oligomerization by co-assembly of β-amyloid and α-synuclein.Front Mol Biosci. 2023 Mar 20;10:1153839. doi: 10.3389/fmolb.2023.1153839. eCollection 2023. Front Mol Biosci. 2023. PMID: 37021111 Free PMC article. Review.
References
-
- Dallaire-Theroux C, Callahan BL, Potvin O, Saikali S, and Duchesne S (2017) Radiological-Pathological Correlation in Alzheimer's Disease: Systematic Review of Antemortem Magnetic Resonance Imaging Findings. J. Alzheimers Dis 57, 575–601. - PubMed
-
- Schirinzi T, Di Lorenzo F, Sancesario GM, Di Lazzaro G, Ponzo V, Pisani A, Mercuri NB, Koch G, and Martorana A (2018) Amyloid-Mediated Cholinergic Dysfunction in Motor Impairment Related to Alzheimer's Disease. J. Alzheimers Dis 64, 525–532. - PubMed
-
- Aguzzi A, and O'Connor T (2010) Protein aggregation diseases: pathogenicity and therapeutic perspectives. Nat. Rev. Drug Discov 9, 237–248. - PubMed
-
- Hardy JA, and Higgins GA (1992) Alzheimer's disease: the amyloid cascade hypothesis. Science 256, 184–185. - PubMed
Publication types
MeSH terms
Substances
Grants and funding
LinkOut - more resources
Full Text Sources

