Transcriptional profiling of microglia; current state of the art and future perspectives
- PMID: 31846124
- PMCID: PMC7064956
- DOI: 10.1002/glia.23767
Transcriptional profiling of microglia; current state of the art and future perspectives
Abstract
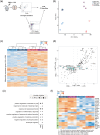
Microglia are the tissue macrophages of the central nervous system (CNS) and the first to respond to CNS dysfunction and disease. Gene expression profiling of microglia during development, under homeostatic conditions, and in the diseased CNS provided insight in microglia functions and changes thereof. Single-cell sequencing studies further contributed to our understanding of microglia heterogeneity in relation to age, sex, and CNS disease. Recently, single nucleus gene expression profiling was performed on (frozen) CNS tissue. Transcriptomic profiling of CNS tissues by (single) nucleus RNA-sequencing has the advantage that it can be applied to archived and well-stratified frozen specimens. Here, we give an overview of the significant advances recently made in microglia transcriptional profiling. In addition, we present matched cellular and nuclear microglia RNA-seq datasets we generated from mouse and human CNS tissue to compare cellular versus nuclear transcriptomes from fresh and frozen samples. We demonstrate that microglia can be similarly profiled with cell and nucleus profiling, and importantly also with nuclei isolated from frozen tissue. Nuclear microglia transcriptomes are a reliable proxy for cellular transcriptomes. Importantly, lipopolysaccharide-induced changes in gene expression were conserved in the nuclear transcriptome. In addition, heterogeneity in microglia observed in fresh samples was similarly detected in frozen nuclei of the same donor. Together, these results show that microglia nuclear RNAs obtained from frozen CNS tissue are a reliable proxy for microglia gene expression and cellular heterogeneity and may prove an effective strategy to study of the role of microglia in neuropathology.
Keywords: human; microglia; mouse; single-cell RNA-sequencing; single-nucleus RNA-sequencing; transcriptomes.
© 2019 The Authors. Glia published by Wiley Periodicals, Inc.
Figures


Similar articles
-
Single-nucleus and single-cell transcriptomes compared in matched cortical cell types.PLoS One. 2018 Dec 26;13(12):e0209648. doi: 10.1371/journal.pone.0209648. eCollection 2018. PLoS One. 2018. PMID: 30586455 Free PMC article.
-
Building an RNA Sequencing Transcriptome of the Central Nervous System.Neuroscientist. 2016 Dec;22(6):579-592. doi: 10.1177/1073858415610541. Epub 2015 Oct 13. Neuroscientist. 2016. PMID: 26463470 Free PMC article. Review.
-
Using single-nucleus RNA-sequencing to interrogate transcriptomic profiles of archived human pancreatic islets.Genome Med. 2021 Aug 10;13(1):128. doi: 10.1186/s13073-021-00941-8. Genome Med. 2021. PMID: 34376240 Free PMC article.
-
The effects of postmortem delay on mouse and human microglia gene expression.Glia. 2021 Apr;69(4):1053-1060. doi: 10.1002/glia.23948. Epub 2020 Dec 9. Glia. 2021. PMID: 33296111 Free PMC article.
-
Regulation of Microglia Identity from an Epigenetic and Transcriptomic Point of View.Neuroscience. 2019 May 1;405:3-13. doi: 10.1016/j.neuroscience.2017.12.010. Epub 2017 Dec 14. Neuroscience. 2019. PMID: 29247774 Review.
Cited by
-
Transcript Profiles of Microglia/Macrophage Cells at the Borders of Chronic Active and Subpial Gray Matter Lesions in Multiple Sclerosis.Ann Neurol. 2024 May;95(5):907-916. doi: 10.1002/ana.26877. Epub 2024 Feb 12. Ann Neurol. 2024. PMID: 38345145
-
Diversity of transcriptomic microglial phenotypes in aging and Alzheimer's disease.Alzheimers Dement. 2022 Feb;18(2):360-376. doi: 10.1002/alz.12389. Epub 2021 Jul 5. Alzheimers Dement. 2022. PMID: 34223696 Free PMC article. Review.
-
Cytokine Profiling in Human iPSC-Derived Dopaminergic Neuronal and Microglial Cultures.Cells. 2023 Oct 27;12(21):2535. doi: 10.3390/cells12212535. Cells. 2023. PMID: 37947613 Free PMC article.
-
Microglial Phagocytosis During Embryonic and Postnatal Development.Adv Neurobiol. 2024;37:151-161. doi: 10.1007/978-3-031-55529-9_9. Adv Neurobiol. 2024. PMID: 39207691 Review.
-
Identification of distinct and age-dependent p16High microglia subtypes.Aging Cell. 2021 Oct;20(10):e13450. doi: 10.1111/acel.13450. Epub 2021 Oct 1. Aging Cell. 2021. PMID: 34598318 Free PMC article.
References
-
- Bennett, M. L. , Bennett, F. C. , Liddelow, S. A. , Ajami, B. , Zamanian, J. L. , Fernhoff, N. B. , … Barres, B. A. (2016). New tools for studying microglia in the mouse and human CNS. Proceedings of the National Academy of Sciences of the United States of America, 113(12), E1738–E1746. 10.1073/pnas.1525528113 - DOI - PMC - PubMed
Publication types
MeSH terms
LinkOut - more resources
Full Text Sources

