

Protein Network Structure Enables Switching between Liquid and Gel States
- PMID: 31845799
- PMCID: PMC7531186
- DOI: 10.1021/jacs.9b10066
Protein Network Structure Enables Switching between Liquid and Gel States
Abstract
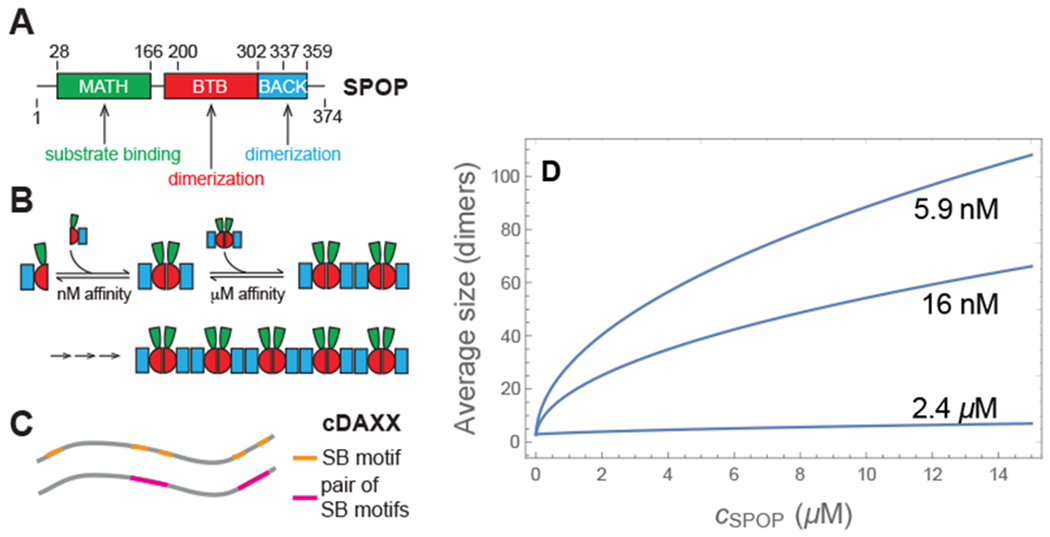
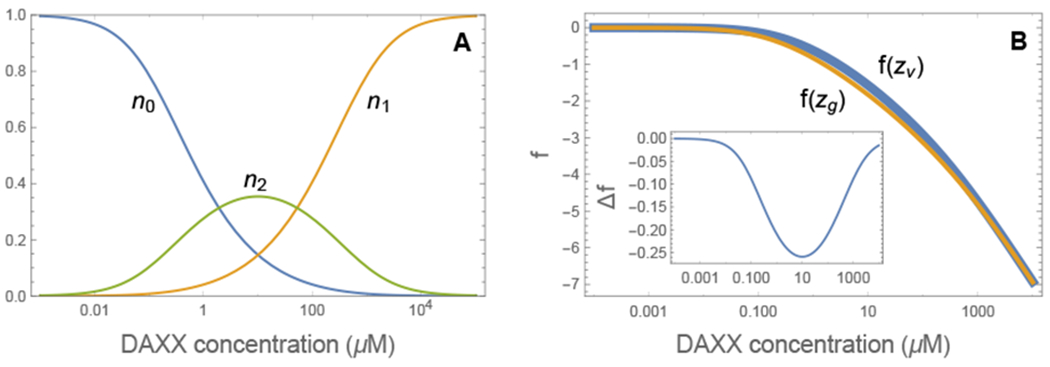
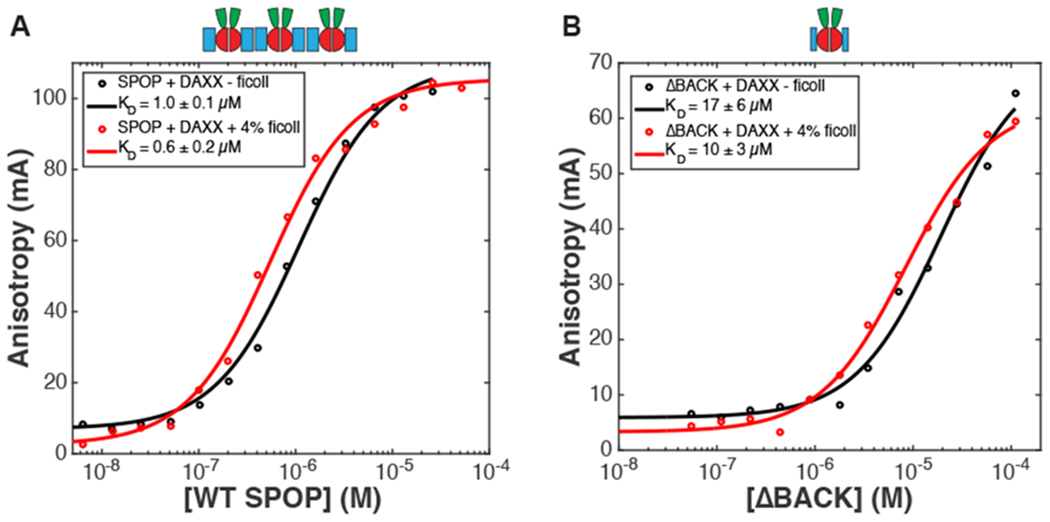
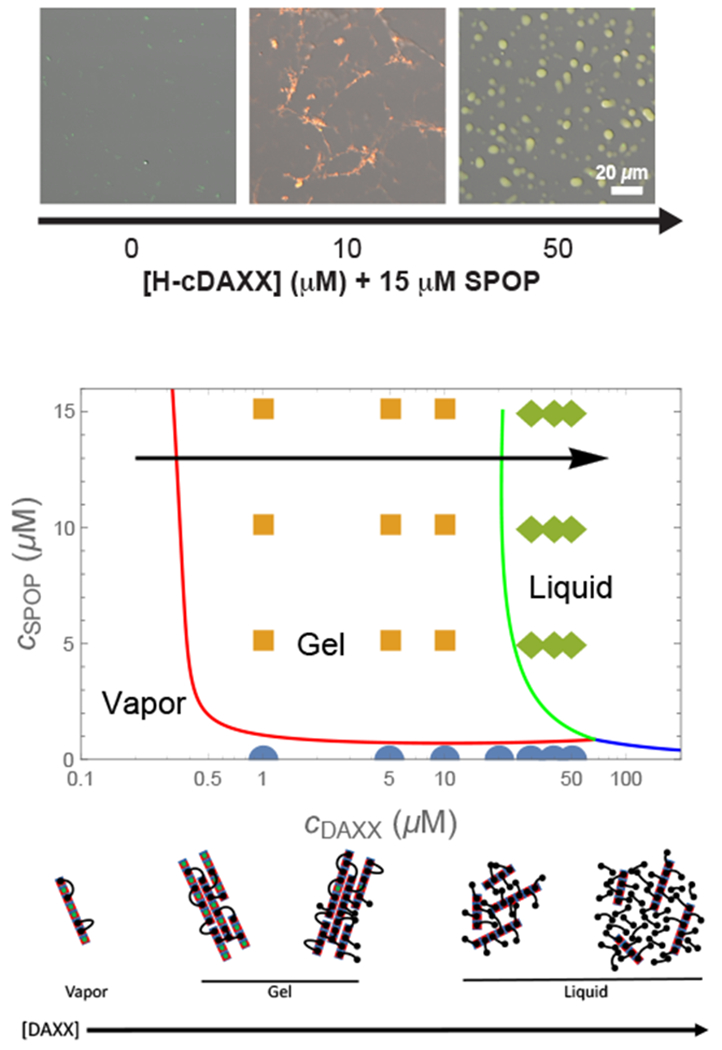
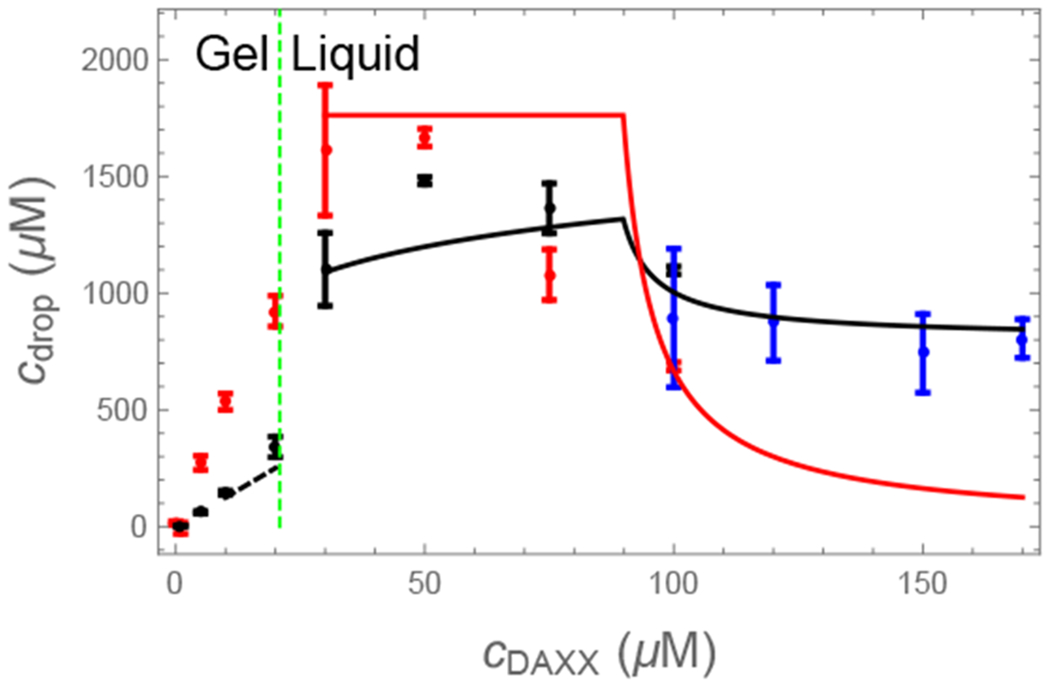
Biomolecular condensates are emerging as an important organizational principle within living cells. These condensed states are formed by phase separation, yet little is known about how material properties are encoded within the constituent molecules and how the specificity for being in different phases is established. Here we use analytic theory to explain the phase behavior of the cancer-related protein SPOP and its substrate DAXX. Binary mixtures of these molecules have a phase diagram that contains dilute liquid, dense liquid, and gel states. We show that these discrete phases appear due to a competition between SPOP-DAXX and DAXX-DAXX interactions. The stronger SPOP-DAXX interactions dominate at sub-stoichiometric DAXX concentrations leading to the formation of cross-linked gels. The theory shows that the driving force for gel formation is not the binding energy, but rather the entropy of distributing DAXX molecules on the binding sites. At high DAXX concentrations the SPOP-DAXX interactions saturate, which leads to the dissolution of the gel and the appearance of a liquid phase driven by weaker DAXX-DAXX interactions. This competition between interactions allows multiple dense phases to form in a narrow region of parameter space. We propose that the molecular architecture of phase-separating proteins governs the internal structure of dense phases, their material properties and their functions. Analytical theory can reveal these properties on the long length and time scales relevant to biomolecular condensates.
Figures
Similar articles
-
Reduction of oligomer size modulates the competition between cluster formation and phase separation of the tumor suppressor SPOP.J Biol Chem. 2023 Dec;299(12):105427. doi: 10.1016/j.jbc.2023.105427. Epub 2023 Nov 4. J Biol Chem. 2023. PMID: 37926283 Free PMC article.
-
Reduction of oligomer size modulates the competition between cluster formation and phase separation of the tumor suppressor SPOP.bioRxiv [Preprint]. 2023 Mar 21:2023.02.11.528154. doi: 10.1101/2023.02.11.528154. bioRxiv. 2023. Update in: J Biol Chem. 2023 Dec;299(12):105427. doi: 10.1016/j.jbc.2023.105427. PMID: 36993550 Free PMC article. Updated. Preprint.
-
Daxx-mediated transcriptional repression of MMP1 gene is reversed by SPOP.Biochem Biophys Res Commun. 2004 Jul 30;320(3):760-5. doi: 10.1016/j.bbrc.2004.06.022. Biochem Biophys Res Commun. 2004. PMID: 15240113
-
How Hierarchical Interactions Make Membraneless Organelles Tick Like Clockwork.Trends Biochem Sci. 2021 Jul;46(7):525-534. doi: 10.1016/j.tibs.2020.12.011. Epub 2021 Jan 20. Trends Biochem Sci. 2021. PMID: 33483232 Free PMC article. Review.
-
Sequence determinants and solution conditions underlying liquid to solid phase transition.Am J Physiol Cell Physiol. 2023 Feb 1;324(2):C236-C246. doi: 10.1152/ajpcell.00280.2022. Epub 2022 Dec 12. Am J Physiol Cell Physiol. 2023. PMID: 36503242 Review.
Cited by
-
Uncovering the molecular mechanism for dual effect of ATP on phase separation in FUS solution.Sci Adv. 2022 Sep 16;8(37):eabo7885. doi: 10.1126/sciadv.abo7885. Epub 2022 Sep 14. Sci Adv. 2022. PMID: 36103543 Free PMC article.
-
Fundamental Aspects of Phase-Separated Biomolecular Condensates.Chem Rev. 2024 Jul 10;124(13):8550-8595. doi: 10.1021/acs.chemrev.4c00138. Epub 2024 Jun 17. Chem Rev. 2024. PMID: 38885177 Review.
-
Surface Charge Can Modulate Phase Separation of Multidomain Proteins.J Am Chem Soc. 2024 Feb 7;146(5):3383-3395. doi: 10.1021/jacs.3c12789. Epub 2024 Jan 23. J Am Chem Soc. 2024. PMID: 38262618 Free PMC article.
-
An Introduction to the Stickers-and-Spacers Framework as Applied to Biomolecular Condensates.Methods Mol Biol. 2023;2563:95-116. doi: 10.1007/978-1-0716-2663-4_4. Methods Mol Biol. 2023. PMID: 36227469
-
A conceptual framework for understanding phase separation and addressing open questions and challenges.Mol Cell. 2022 Jun 16;82(12):2201-2214. doi: 10.1016/j.molcel.2022.05.018. Epub 2022 Jun 7. Mol Cell. 2022. PMID: 35675815 Free PMC article. Review.
References
-
- Shin Y; Brangwynne CP Liquid phase condensation in cell physiology and disease. Science. 2017, 357, eaaf4382. - PubMed
-
- Franzmann TM; Jahnel M; Pozniakovsky A; Mahamid J; Holehouse AS; Nüske E; Richter D; Baumeister W; Grill SW; Pappu RV; Hyman AA; Alberti S Phase separation of a yeast prion protein promotes cellular fitness. Science. 2018, 359, eaao5654. - PubMed
-
- Rai AK; Chen JX; Selbach M; Pelkmans L Kinase-controlled phase transition of membraneless organelles in mitosis. Nature 2018, 559, 211–216. - PubMed
Publication types
MeSH terms
Substances
Grants and funding
LinkOut - more resources
Full Text Sources
