. 2019 Dec 16;10(1):5718.
doi: 10.1038/s41467-019-13667-4.

ATAD5 promotes replication restart by regulating RAD51 and PCNA in response to replication stress

Affiliations

ATAD5 promotes replication restart by regulating RAD51 and PCNA in response to replication stress

Su Hyung Park et al. Nat Commun. .

Abstract

Maintaining stability of replication forks is important for genomic integrity. However, it is not clear how replisome proteins contribute to fork stability under replication stress. Here, we report that ATAD5, a PCNA unloader, plays multiple functions at stalled forks including promoting its restart. ATAD5 depletion increases genomic instability upon hydroxyurea treatment in cultured cells and mice. ATAD5 recruits RAD51 to stalled forks in an ATR kinase-dependent manner by hydroxyurea-enhanced protein-protein interactions and timely removes PCNA from stalled forks for RAD51 recruitment. Consistent with the role of RAD51 in fork regression, ATAD5 depletion inhibits slowdown of fork progression and native 5-bromo-2'-deoxyuridine signal induced by hydroxyurea. Single-molecule FRET showed that PCNA itself acts as a mechanical barrier to fork regression. Consequently, DNA breaks required for fork restart are reduced by ATAD5 depletion. Collectively, our results suggest an important role of ATAD5 in maintaining genome integrity during replication stress.


Conflict of interest statement

The authors declare no competing interests.

Figures
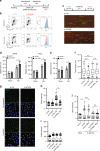
Fig. 1
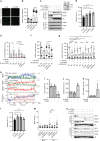
Fig. 1. ATAD5 promotes replication fork restart at stalled replication forks.
a The scheme for cell cycle arrest (Noco-APH condition). U2OS cells were arrested at the G1/S boundary and then released from arrest in normal media for 4 h. Human ATAD5 small interfering (si) RNA was transfected when cells were re-seeded after shaking-off. b U2OS cells released from arrest for 4 h were collected for cell cycle analysis. Asynchronous cells were transfected with ATAD5 siRNA for 48 h before cell collection. Under both conditions, cells were pulse-labeled with 5-ethynyl-2ʹ-deoxyuridine (EdU) for 30 min before cell collection. c, d U2OS or HeLa cells were transfected with ATAD5 siRNA under the Noco-APH condition. e U2OS cells expressing ATAD5AID were pre-treated with auxin. ce After depletion of ATAD5, cells were analyzed using a DNA combing assay. c Representative images of replication tract. Each asterisk (*) indicates a stalled replication fork. d, e The percentages of stalled forks are displayed. Error bars represent standard deviation of the mean (n = 3). Statistical analysis: t test; *p < 0.05. f U2OS cells were transfected with ATAD5 siRNA under the Noco-APH condition. Then, cells were subjected for a DNA combing assay. The length of l-dU-labeled DNA track was measured. gj U2OS cells transfected with ATAD5 siRNA under the Noco-APH condition were labeled with 5-bromo-2ʹ-deoxyuridine (BrdU) for 10 min and incubated with 2 mM HU for 4 h before fixation. g, h, j Single-stranded DNA with BrdU exposed was visualized by staining with an anti-BrdU antibody under native non-denaturing conditions. i Total BrdU in DNA was detected under denaturing conditions as a control. g Representative images of anti-BrdU antibody staining. Scale bar: 20 μm. h, i The intensity of BrdU staining was quantified from ~200 cells and plotted. Three independent experiments were performed and one representative result was displayed. j 50 μM mirin was simultaneously administered with 2 mM HU for 4 h before fixation. f, h, i, j Boxes indicate median and interquartile ranges and whiskers indicate the 5th–95th percentile. Statistical analysis: Mann–Whitney U test; ****p < 0.0001, ***p < 0.001, **p < 0.01, n.s., not significant.
Fig. 2
Fig. 2. ATAD5 promotes RAD51 recruitment to stalled replication forks, which depends on the PCNA unloading activity of ATAD5.
a, b, d, l, m U2OS cells were transfected with siRNA under the Noco-APH condition. a, b Cells were treated with 2 mM HU for 3 h before fixation for immunostaining. a Representative images of chromatin-bound RAD51. Scale bar: 20 μm. b The intensity of RAD51 staining was quantified. c After transfection, HEK293T cells were processed for iPOND immunoblotting. The right panel shows chromatin-bound proteins. d After transfection, cells were subjected for a DNA combing assay (n = 5). e U2OS cells expressing ATAD5AID transfected with a cDNA expression vector were subjected for a SIRF assay (n = 3 unless indicated). f, g U2OS-TetOn-ATAD5 cell lines were treated with doxycycline and transfected under the Noco-APH condition. f The staining intensity of chromatin-bound RAD51 was quantified. g Cells were analyzed using a DNA combing assay. The length of I-dU-labeled DNA track was measured. h Representative time traces of Alexa488 (blue), Cy3 (green), and Cy5 (red) at Alexa488 excitation (top panel), at Cy3 excitation (second panel), and at Cy5 excitation (third panel). The time trace of Cy3-Cy5 FRET at Cy3 excitation is presented at the bottom panel. Three events: ATP-Mg2+ injection (blue), formation of a four-way junction (yellow), and dissociation of daughter strands (green) are indicated by color lines, respectively. Time delays between the events are defined as τi (initiation time) and τd (FRET dwell time, region with red shade). i Percentages of molecules that exhibit fork reversal activity (n > 5). j Average τi (n > 5). k Average τd (n > 4). l DNA combing assay (n = 4). m Native BrdU assay. n HEK293T cells transfected were processed for iPOND immunoblotting. b, f, g, m Boxes indicate median and interquartile ranges and whiskers indicate the 5th–95th percentile. Statistical analysis: Mann–Whitney U test. d, e, l Statistical analysis: t test; ****p < 0.0001, ***p < 0.001, **p < 0.01, *p < 0.05, n.s., not significant. d, ik, l Error bars represent standard deviation of the mean.
Fig. 3
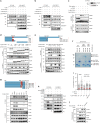
Fig. 3. The interaction of ATAD5 with RAD51 is increased under replication stress.
ae, g, h HEK293T cells were transfected with a cDNA expression vector or siRNA as indicated. After 48 h, cells were treated with 2 mM HU and whole-cell extracts were prepared for immunoprecipitation. a, b Cells were transfected with a cDNA expression vector expressing FLAG-tagged ATAD5 (FLAG-ATAD5) or FLAG-tagged UAF1 (FLAG-UAF1), or an empty vector (FLAG). After 48 h, cells were treated simultaneously with 2 mM HU or 2 μM ATR inhibitor (ATRi, ETP-46464) for 6 h. c HEK293T cells transfected with ATAD5 siRNA for 48 h were labeled with 10 μM EdU for 20 min prior to the addition of 2 mM HU or 2 μM ATRi as indicated. Samples were processed for iPOND, and captured proteins were separated by SDS-PAGE and immunoblotted. The right panel shows chromatin-bound proteins extracted from a portion of cells in c separated by SDS-PAGE and immunoblotted. d, e Cells were transfected with an expression vector expressing full-length (FL) or deletion mutants of FLAG-ATAD5. A schematic diagram of the ATAD5 deletion mutants is shown on the top. Boxes in red represent RAD51-interacting regions. + indicates that the interaction exists. f Purified GST, GST-RAD51, or GST-UAF1 proteins were mixed with purified ATAD5 protein fragments and pulled down for Coomassie staining. g Cells were transfected with DNA vectors expressing deletion mutants of FLAG-ATAD5. A schematic diagram of the ATAD5 deletion mutants is shown on the top. Boxes in red represent RAD51-interacting regions. The symbol + indicates that the interaction exists. h Cells were transfected with a DNA vector expressing FLAG-tagged ATAD5 C-terminal fragment (N693). After 6 h of transfection, cells were transfected with RFC4 siRNA. i U2OS cells expressing ATAD5AID were transfected with a cDNA expression vector, treated with auxin, and fixed for a SIRF assay. Three independent experiments were performed and one representative result was displayed. Statistical analysis for i: t test; ****p < 0.0001, ***p < 0.001, *p < 0.05. j Chromatin-bound proteins extracted from a portion of cells in i were subjected for immunoblotting.
Fig. 4
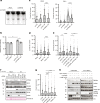
Fig. 4. ATAD5 promotes generation of single-stranded DNA-associated breaks in response to replication stress.
a U2OS cells transfected with ATAD5 siRNA under the Noco-APH condition were treated with 2 mM HU for 3 or 6 h. Then, chromatin-bound proteins were fractionated and subjected for immunoblotting. b, c U2OS cells transfected with ATAD5 siRNA under the Noco-APH condition were treated with 2 mM HU for 3 h before fixation. The fixed cells were stained with an anti-pRPA2 S4/S8 antibody. b Representative images of chromatin-bound pRPA2 S4/S8. Scale bar: 20 μm. c The intensity of chromatin-bound pRPA2 S4/S8 staining was quantified from ~20,000 cells. Error bars represent standard deviation of the mean (n = 3). Statistical analysis: t test; *p < 0.05. d U2OS cells expressing ATAD5AID were pre-treated with auxin and treated with 2 mM HU for 3 or 6 h. Chromatin-bound proteins were separated by SDS-PAGE and subjected for immunoblotting with indicated antibodies. e U2OS cells transfected with a combination of ATAD5 siRNA and a DNA vector expressing ATAD5-myc under the Noco-APH condition were treated with 2 mM HU for 6 h. Then, chromatin-bound proteins were fractionated and subjected for immunoblotting. f U2OS cells transfected with ATAD5 siRNA under the Noco-APH condition were treated with 2 mM HU or 1 μM CDC7 inhibitor (CDC7i, PHA-76941) for the indicated times. Then, chromatin-bound proteins were fractionated and subjected for immunoblotting. g HEK293T cells transfected with ATAD5 siRNA for 48 h were labeled with 10 μM EdU for 20 min prior to treatment with 2 mM HU as indicated. Samples were processed for iPOND, and captured proteins were separated by SDS-PAGE and immunoblotted. h U2OS-TetOn-ATAD5 cells treated with doxycyclinfor 24 h before entering the Noco-APH condition were treated with 2 mM HU for 6 h. Chromatin-bound proteins were fractionated and subjected for immunoblotting. ij U2OS cells transfected with siRNAs or treated with a RAD51 inhibitor (B02, 10, 20, 40 μM) at the time of release from aphidicolin under the Noco-APH condition were treated with 2 mM HU as indicated. Chromatin-bound proteins were fractionated and subjected for immunoblotting.
Fig. 5
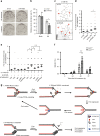
Fig. 5. ATAD5 promotes generation of MUS81-mediated single-stranded DNA-associated breaks in response to replication stress.
a, b U2OS cells transfected with ATAD5 siRNA under the Noco-APH condition were treated with 2 mM HU for 6 h before being collected for analysis by pulsed field gel electrophoresis. a Representative data from three independent experiments. Asterisk (*) indicates a DNA break. b DNA breaks were quantified and displayed (N = 4). c U2OS or HeLa cells transfected with ATAD5 siRNA under the Noco-APH condition were treated with 2 mM HU for 6 h before being collected for a neutral COMET assay. The tail moment was calculated from ~200 cells and plotted. d U2OS cells expressing ATAD5AID were pre-treated with auxin and treated with 2 mM HU for another 6 h before being collected for a neutral COMET assay. Two independent experiments were performed, and one representative result is displayed. e U2OS-TetOn-ATAD5 cells treated with doxycycline for 24 h before entering the Noco-APH condition were treated with 2 mM HU for 6 h before collection for the neutral COMET assay. f U2OS cells transfected with siRNAs under the Noco-APH condition were treated with 2 mM HU for 6 h. Chromatin-bound proteins were fractionated and subjected to immunoblotting. g U2OS cells transfected with a combination of ATAD5 and MUS81 siRNAs under the Noco-APH condition were treated with 2 mM HU for 6 h before collection for the neutral COMET assay. The tail moment was calculated from ~300 cells and plotted. h HEK293T cells transfected with ATAD5 siRNA for 48 h were labeled with 10 μM EdU for 20 min, washed, and treated with 2 mM HU for the indicated times. Samples were processed for iPOND, and captured proteins were separated by SDS-PAGE and immunoblotted. be, g Error bars represent standard deviation of the mean. Statistical analysis: two-tailed Student’s t test; *p < 0.05, **p < 0.005, ***p < 0.001, and ****p < 0.0001.
Fig. 6
Fig. 6. ATAD5 depletion increases cell death and genomic instability in cells and mice.
a, b U2OS cells transfected with ATAD5 siRNA under the Noco-APH condition were treated with 2 mM HU for 6 h, plated in the absence of drug treatments, incubated for 2 weeks, and examined to detect surviving colonies by methylene blue staining. a Representative images of colony staining. b The viability of the surviving colonies was quantified. Error bars represent standard deviation of the mean (n = 3). Statistical analysis: two-tailed Student’s t test; *p < 0.05. c, d U2OS cells transfected with ATAD5 siRNA under the Noco-APH condition were treated with HU for 6 h and subjected to metaphase spreading. c Representative images of DAPI stained chromosomes are shown. Arrows point to chromosomal breaks. d The number of chromosomal breaks per cell was plotted. Statistical analysis: two-tailed Student’s t test; *p < 0.05. e U2OS-TetOn-ATAD5 cell lines expressing wild-type or two ATAD5 mutants were treated with doxycycline and transfected with ATAD5 siRNA under the Noco-APH condition. Cells were then treated with HU for 6 h and subjected to metaphase spreading. Statistical analysis: two-tailed Student’s t test; *p < 0.05. n.s., not significant. f Atad5 wild-type or mutant mice were analyzed by micronucleus analysis. Error bars represent standard deviation of the mean (n = 8). Statistical analysis: two-way analysis of variance, ***p < 0.001. g The model described in the text.

Similar articles

Cited by

References

    1. Berti M, Vindigni A. Replication stress: getting back on track. Nat. Struct. Mol. Biol. 2016;23:103–109. doi: 10.1038/nsmb.3163. - DOI - PMC - PubMed
    1. Neelsen KJ, Lopes M. Replication fork reversal in eukaryotes: from dead end to dynamic response. Nat. Rev. Mol. Cell. Biol. 2015;16:207–220. doi: 10.1038/nrm3935. - DOI - PubMed
    1. Berti M, et al. Human RECQ1 promotes restart of replication forks reversed by DNA topoisomerase I inhibition. Nat. Struct. Mol. Biol. 2013;20:347–354. doi: 10.1038/nsmb.2501. - DOI - PMC - PubMed
    1. Schlacher K, et al. Double-strand break repair-independent role for BRCA2 in blocking stalled replication fork degradation by MRE11. Cell. 2011;145:529–542. doi: 10.1016/j.cell.2011.03.041. - DOI - PMC - PubMed
    1. Hashimoto Y, Ray Chaudhuri A, Lopes M, Costanzo V. Rad51 protects nascent DNA from Mre11-dependent degradation and promotes continuous DNA synthesis. Nat. Struct. Mol. Biol. 2010;17:1305–1311. doi: 10.1038/nsmb.1927. - DOI - PMC - PubMed

Publication types

MeSH terms