. 2019 Dec 16;17(1):105.
doi: 10.1186/s12915-019-0727-4.

Crossing fitness valleys via double substitutions within codons

Affiliations

Crossing fitness valleys via double substitutions within codons

Frida Belinky et al. BMC Biol. .

Abstract

Background: Single nucleotide substitutions in protein-coding genes can be divided into synonymous (S), with little fitness effect, and non-synonymous (N) ones that alter amino acids and thus generally have a greater effect. Most of the N substitutions are affected by purifying selection that eliminates them from evolving populations. However, additional mutations of nearby bases potentially could alleviate the deleterious effect of single substitutions, making them subject to positive selection. To elucidate the effects of selection on double substitutions in all codons, it is critical to differentiate selection from mutational biases.

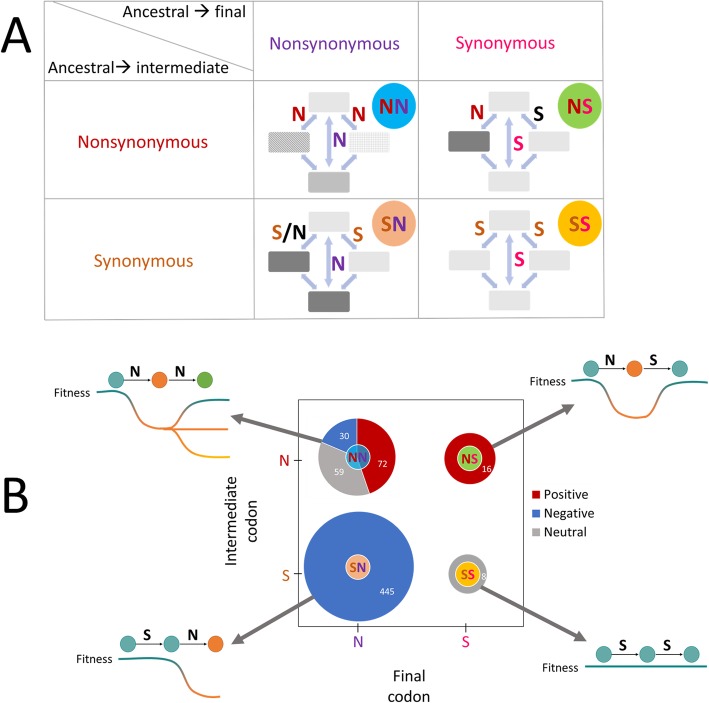
Results: We addressed the evolutionary regimes of within-codon double substitutions in 37 groups of closely related prokaryotic genomes from diverse phyla by comparing the fractions of double substitutions within codons to those of the equivalent double S substitutions in adjacent codons. Under the assumption that substitutions occur one at a time, all within-codon double substitutions can be represented as "ancestral-intermediate-final" sequences (where "intermediate" refers to the first single substitution and "final" refers to the second substitution) and can be partitioned into four classes: (1) SS, S intermediate-S final; (2) SN, S intermediate-N final; (3) NS, N intermediate-S final; and (4) NN, N intermediate-N final. We found that the selective pressure on the second substitution markedly differs among these classes of double substitutions. Analogous to single S (synonymous) substitutions, SS double substitutions evolve neutrally, whereas analogous to single N (non-synonymous) substitutions, SN double substitutions are subject to purifying selection. In contrast, NS show positive selection on the second step because the original amino acid is recovered. The NN double substitutions are heterogeneous and can be subject to either purifying or positive selection, or evolve neutrally, depending on the amino acid similarity between the final or intermediate and the ancestral states.

Conclusions: The results of the present, comprehensive analysis of the evolutionary landscape of within-codon double substitutions reaffirm the largely conservative regime of protein evolution. However, the second step of a double substitution can be subject to positive selection when the first step is deleterious. Such positive selection can result in frequent crossing of valleys on the fitness landscape.

Keywords: Archaea; Bacteria; DNA context; Double substitutions; Natural selection; Short-term evolution.


Conflict of interest statement

The authors declare that they have no competing interests.

Figures

Fig. 1
Fig. 1
Conceptual scheme of double substitution analysis and the double fraction (DF) measure. a Point mutations are assumed to appear one at a time, such that observed double substitutions (b) occur through intermediate single substitution states. For each double substitution instance, there are two possible single substitution trajectories (a1 and a2). b Instances of single or double substitutions are inferred from the genomic data by construction of genomes triplets and relying on parsimony principle (see the “Methods” section). In brief, the parsimony principle implies that mutations occur along the thick branches in the trees shown in b. The double fraction is defined as the ratio between the number of double substitution instances b and the sum of relevant single (a1 + a2) and double (b) substitution instances
Fig. 2
Fig. 2
Null models that are used to infer selection on double substitutions through the DF measure. a The selection on double substitutions is inferred by comparing the DF for codons and their respective null models (NM1 and NM2). Two adjacent codons are illustrated, and the nucleotide position within the codon is indicated, according to the reading frame. The two null models are artificial codons constructed by considering positions from two adjacent codons, denoted codon i (indicated in green) and codon ii (indicated in orange). b The first configuration of the null model NM1. A constant second codon position in codon i, followed by a fourfold degenerate site in the third codon position of codon i which is followed by a twofold degenerate site in the first position of codon ii. All substitutions are synonymous (S). Substitution in a fourfold degenerate site is indicated by blue shading of the mutated codon position, and cyan shading indicates a substitution in a twofold degenerate site. c The second configuration of the null model NM1. A fourfold degenerate site in the third codon i position followed by a twofold degenerate site in the first position of codon ii, which is followed by a constant base in the second codon position of codon ii. All substitutions are synonymous (S). Substitution in a fourfold degenerate site is indicated by blue shading of the mutated codon position, and cyan shading indicates a substitution in a twofold degenerate site. d Null model NM2. A fourfold degenerate site in the third position of codon i followed by a constant first codon position in codon ii and by a fourfold degenerate site in the third codon ii position (skipping the second position of codon ii). All substitutions are synonymous (S), and substitutions in the fourfold degenerate sites are indicated by blue shading of the mutated codon position. e Comparison of DF between the two null models, NM1 (adjacent synonymous substitutions) as in b and c and NM2 (non-adjacent synonymous substitutions) as in d. The difference between the two distributions is significant according to t test (p value = 0.0038) but not significant under the U test (p value = 0.104)
Fig. 3
Fig. 3
Classification of the double codon substitutions. a Four combinations of within-codon double substitutions based on the synonymy of the respective ancestral and derived (final) codons, and synonymy of intermediate state codons to the ancestral codons. Each cell represents one of the four combinations of the two intermediates (non) synonymy and the two final states (non) synonymy. When both are synonymous, the combination is noted as SS. When at least one of the intermediates is synonymous to the ancestral codon, whereas the final codon is non-synonymous to the ancestral state, the combination is classified as SN. When one of the intermediates is non-synonymous to the ancestral codon, whereas the final codon is synonymous to the ancestral, the combination is classified as NS. Finally, when both are non-synonymous, the combination is noted as NN. The text colors represent (non) synonymy of the intermediate and final codons compared to the ancestral: brown, synonymous intermediate; red, non-synonymous intermediate; pink, synonymous final; purple, non-synonymous final. The circle colors are different for each class of codon double substitutions and are the same as in other figures: yellow, SS; light orange, SN; light green, NS; and light blue, NN. b Selective pressure in different codon double substitutions classes. Positive, combinations compatible with positive selection, where a codon double substitution has a significantly higher DF than the corresponding double synonymous substitution and the DF is lower in fast compared to slow evolving genes. Negative, combinations compatible with purifying selection, where a codon double substitution has a significantly lower DF than the corresponding double synonymous substitution and the DF is higher in fast compared to slow evolving genes. Neutral, combinations where the codon DF was not significantly different from that of the corresponding synonymous DF and the DF is similar in fast and slow evolving genes. All SS, SN, and NS combinations show compatible results in the comparison of the DF to the double synonymous null models, and in the comparison of the DF between fast and slow evolving genes, and thus are collectively presented as being subject to neutral evolution, negative and positive selection, respectively. However, the NN combinations show conflicting results between the comparison of DF to double synonymous control null models and the comparison of DF between fast and slow evolving genes, and are therefore presented as a combination of positive, negative, and neutral regimes, based on the individual comparisons to the specific null models with the same base composition
Fig. 4
Fig. 4
Selective regimes of the codon double substitutions. The panels on the left show the comparison of each codon double substitution class to the double synonymous null models, and the panels to the right show the comparisons between the DF of each of the classes in fast vs. slow evolving genes. Purple, NM1; gray, NM2; light green, NS; yellow, SS; light orange, SN; light blue, NN. b NS, one non-synonymous intermediate, synonymous final codon. t test with NM1 p value = 1.92 × 10−09, U test with NM1 p value = 4.40 × 10−05, t test with NM2 p value = 1.11 × 10−27, U test with NM2 p value = 1.12 × 10−06. b SS, double synonymous codon substitutions. t test with NM1 p value = 0.25, U test with NM1 p value = 0.13, t test with NM2 p value = 0.007, U test with NM2 p value = 0.02. c SN, at least one synonymous intermediate codon, non-synonymous final codon. t test with NM1 p value = 9.73 × 10−127, U test with NM1 p value = 8.17 × 10−70, t test with NM2 p value = 7.72 × 10−232, U test with NM2 p value = 2.7 × 10−177. d NN, both intermediates and the final codon are non-synonymous to the ancestral. t test with NM1 p value = 0.14, U test with NM1 p value = 0.94, t test with NM2 p value = 1.45 × 10−07, U test with NM2 p value = 0.19
Fig. 5
Fig. 5
Similarity between the ancestral, intermediate, and final amino acids for different classes of double substitutions. The DAS metric measures the difference in amino acid similarity/distance for the original➔final vs. original➔intermediate codons. DAS = AA similarity/distance (original➔final) − average AA similarity/distance (original➔intermediate). Three comparisons, using different amino acid similarity/distance matrices, are shown. a NN double substitutions. b SN double substitutions. c NS double substitutions

Similar articles

Cited by

References

    1. McCandlish DM, Stoltzfus A. Modeling evolution using the probability of fixation: history and implications. Q Rev Biol. 2014;89(3):225–252. doi: 10.1086/677571. - DOI - PubMed
    1. Felsenstein J. Evolutionary trees from DNA sequences: a maximum likelihood approach. J Mol Evol. 1981;17(6):368–376. doi: 10.1007/BF01734359. - DOI - PubMed
    1. Blair C, Murphy RW. Recent trends in molecular phylogenetic analysis: where to next? J Hered. 2011;102(1):130–138. doi: 10.1093/jhered/esq092. - DOI - PubMed
    1. Yang Z, Rannala B. Molecular phylogenetics: principles and practice. Nat Rev Genet. 2012;13(5):303–314. doi: 10.1038/nrg3186. - DOI - PubMed
    1. Kimura M. The neutral theory of molecular evolution: Cambridge University Press. 1983.

Publication types

LinkOut - more resources