

Transcriptomic Analyses Revealed Systemic Alterations in Gene Expression in Circulation and Tumor Microenvironment of Colorectal Cancer Patients
- PMID: 31835892
- PMCID: PMC6966620
- DOI: 10.3390/cancers11121994
Transcriptomic Analyses Revealed Systemic Alterations in Gene Expression in Circulation and Tumor Microenvironment of Colorectal Cancer Patients
Abstract
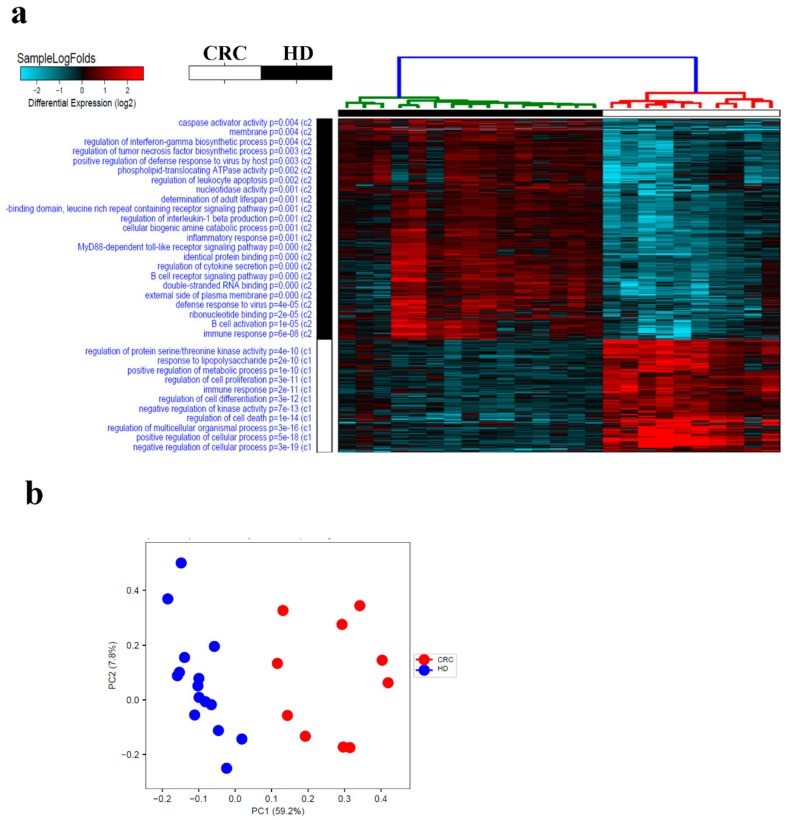
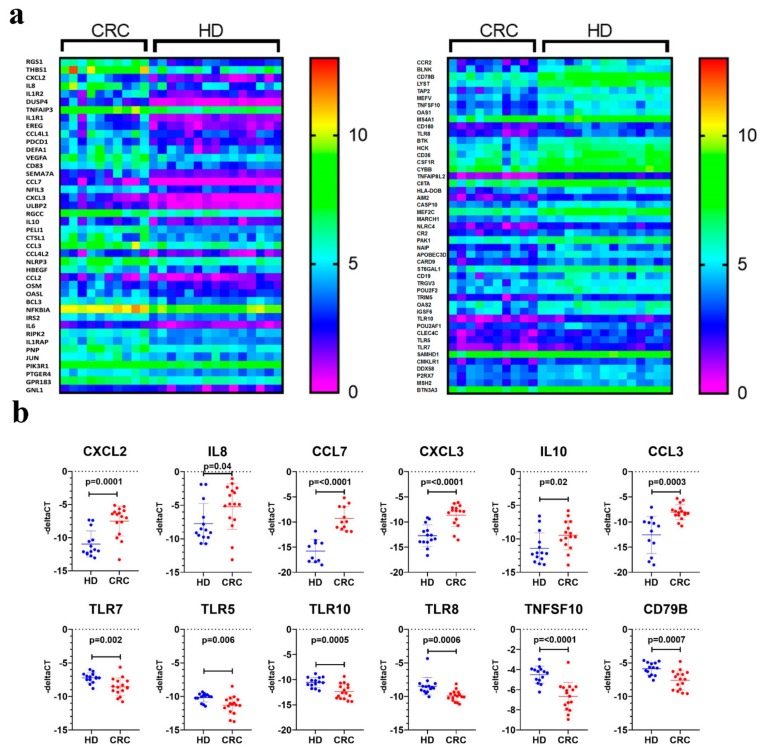
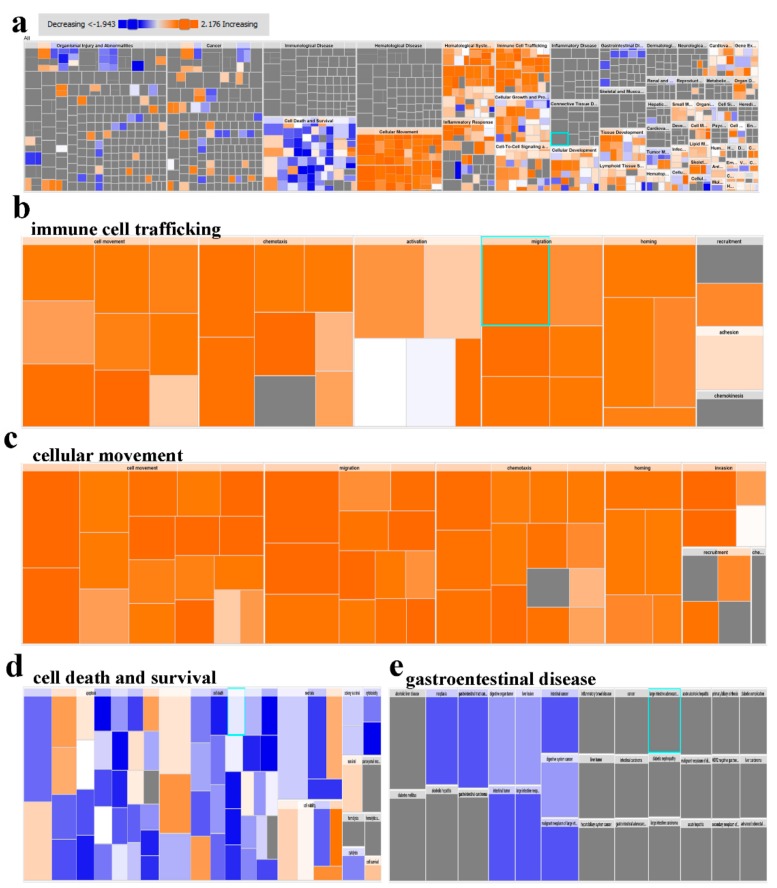
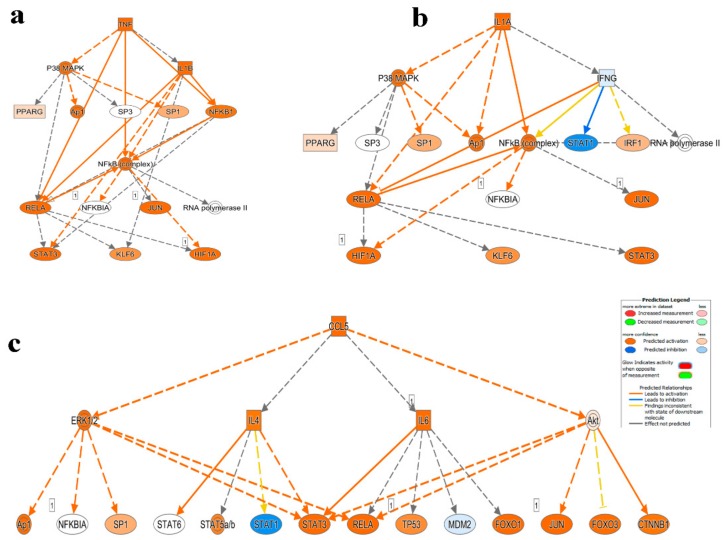
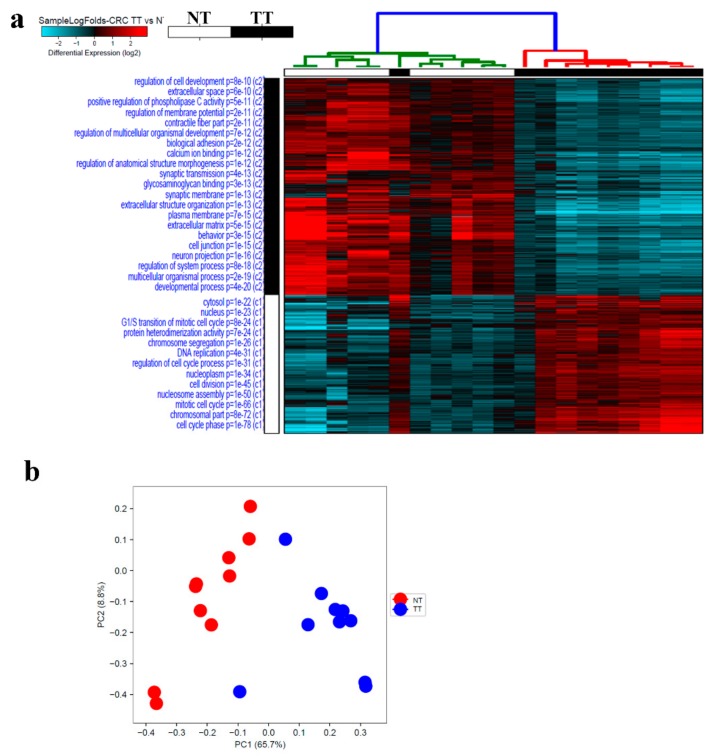
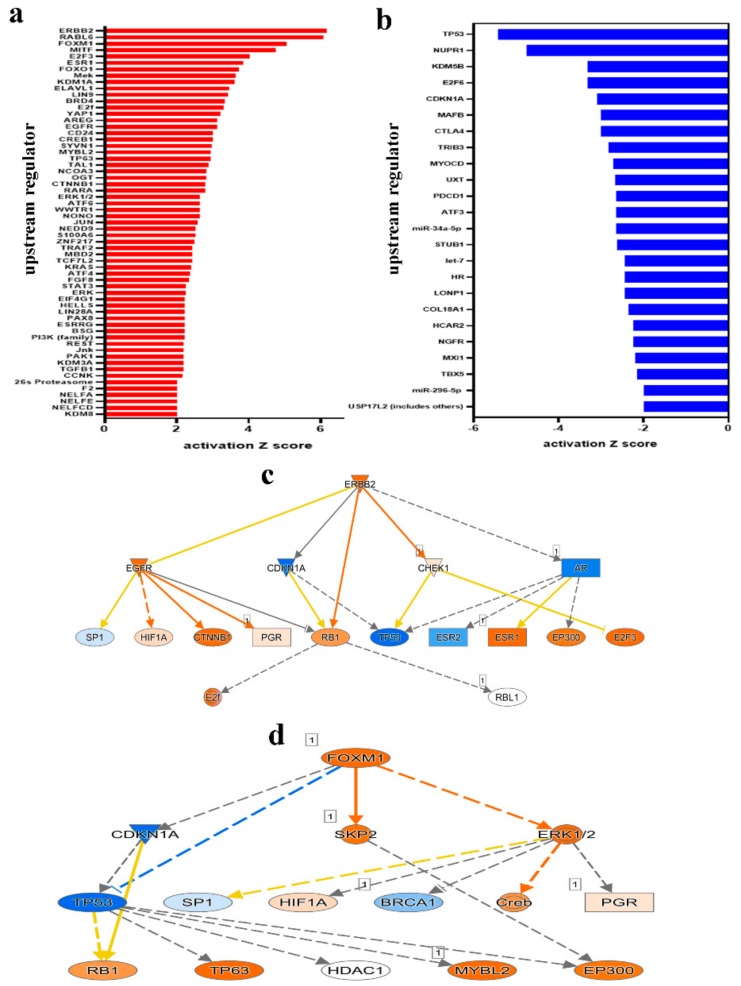
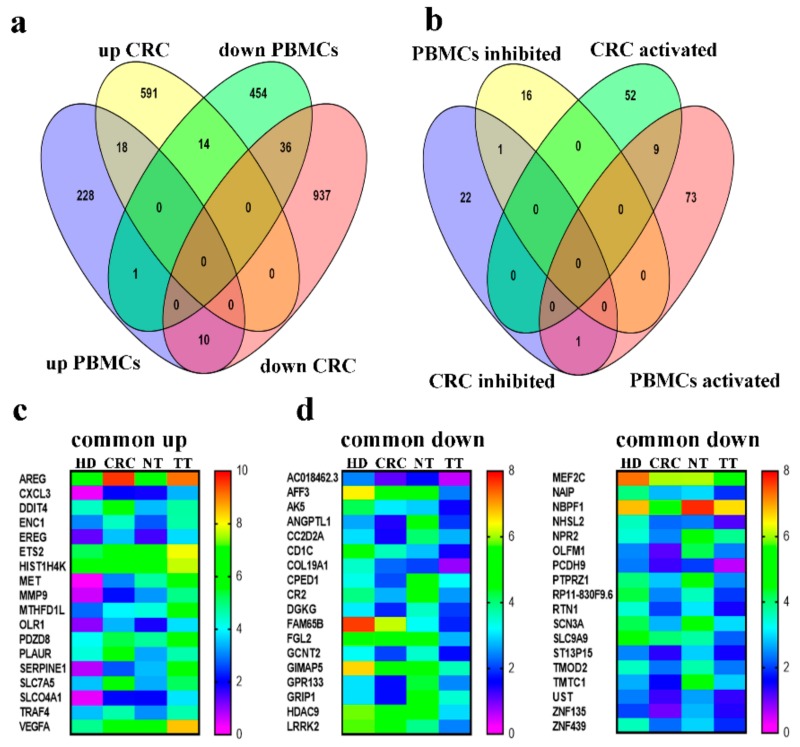
Colorectal cancer (CRC) is among the leading causes of cancer-related deaths worldwide, underscoring a need for better understanding of the disease and development of novel diagnostic biomarkers and therapeutic interventions. Herein, we performed transcriptome analyses on peripheral blood mononuclear cells (PBMCs), CRC tumor tissue and adjacent normal tissue from 10 CRC patients and PBMCs from 15 healthy controls. Up regulated transcripts from CRC PBMCs were associated with functions related to immune cell trafficking and cellular movement, while downregulated transcripts were enriched in cellular processes related to cell death. Most affected signaling networks were those involved in tumor necrosis factor (TNF) and interleukin signaling. The expression of selected immune-related genes from the RNA-Seq data were further validated using qRT-PCR. Transcriptome analysis of CRC tumors and ingenuity pathway analysis revealed enrichment in several functional categories related to cellular movement, cell growth and proliferation, DNA replication, recombination and repair, while functional categories related to cell death were suppressed. Upstream regulator analysis revealed activation of ERBB2 and FOXM1 networks. Interestingly, there were 18 common upregulated and 36 common downregulated genes when comparing PBMCs and tumor tissue, suggesting transcriptomic changes in the tumor microenvironment could be reflected, in part, in the periphery with potential utilization as disease biomarkers.
Keywords: colorectal cancer (CRC), peripheral blood mononuclear cell (PBMC), transcriptome sequencing; differential expression; disease biomarkers; immune regulation; inflammation.
Conflict of interest statement
The authors declare no conflict of interest.
Figures

Similar articles
-
Integrated Transcriptome and Pathway Analyses Revealed Multiple Activated Pathways in Breast Cancer.Front Oncol. 2019 Sep 18;9:910. doi: 10.3389/fonc.2019.00910. eCollection 2019. Front Oncol. 2019. PMID: 31620367 Free PMC article.
-
RNA sequencing reveals the expression profiles of circRNA and indicates that circDDX17 acts as a tumor suppressor in colorectal cancer.J Exp Clin Cancer Res. 2018 Dec 27;37(1):325. doi: 10.1186/s13046-018-1006-x. J Exp Clin Cancer Res. 2018. PMID: 30591054 Free PMC article.
-
Single-cell transcriptome analysis reveals tumor immune microenvironment heterogenicity and granulocytes enrichment in colorectal cancer liver metastases.Cancer Lett. 2020 Feb 1;470:84-94. doi: 10.1016/j.canlet.2019.10.016. Epub 2019 Oct 11. Cancer Lett. 2020. PMID: 31610266
-
Transcriptome Analysis of Peripheral Blood Mononuclear Cells in Pulmonary Sarcoidosis.Front Med (Lausanne). 2022 Jan 24;9:822094. doi: 10.3389/fmed.2022.822094. eCollection 2022. Front Med (Lausanne). 2022. PMID: 35141260 Free PMC article.
-
Impact of the immune system and immunotherapy in colorectal cancer.J Gastrointest Oncol. 2015 Apr;6(2):208-23. doi: 10.3978/j.issn.2078-6891.2014.077. J Gastrointest Oncol. 2015. PMID: 25830040 Free PMC article. Review.
Cited by
-
Protein Coding and Long Noncoding RNA (lncRNA) Transcriptional Landscape in SARS-CoV-2 Infected Bronchial Epithelial Cells Highlight a Role for Interferon and Inflammatory Response.Genes (Basel). 2020 Jul 7;11(7):760. doi: 10.3390/genes11070760. Genes (Basel). 2020. PMID: 32646047 Free PMC article.
-
Computational and Transcriptome Analyses Revealed Preferential Induction of Chemotaxis and Lipid Synthesis by SARS-CoV-2.Biology (Basel). 2020 Sep 1;9(9):260. doi: 10.3390/biology9090260. Biology (Basel). 2020. PMID: 32882823 Free PMC article.
-
Therapeutic targeting of the TPX2/TTK network in colorectal cancer.Cell Commun Signal. 2023 Sep 28;21(1):265. doi: 10.1186/s12964-023-01290-2. Cell Commun Signal. 2023. PMID: 37770979 Free PMC article.
-
Integrated whole transcriptome and small RNA analysis revealed multiple regulatory networks in colorectal cancer.Sci Rep. 2021 Jul 14;11(1):14456. doi: 10.1038/s41598-021-93531-y. Sci Rep. 2021. PMID: 34262080 Free PMC article.
-
Logistic PCA explains differences between genome-scale metabolic models in terms of metabolic pathways.PLoS Comput Biol. 2024 Jun 24;20(6):e1012236. doi: 10.1371/journal.pcbi.1012236. eCollection 2024 Jun. PLoS Comput Biol. 2024. PMID: 38913731 Free PMC article.
References
-
- Society A.C. Key Statistics for Colorectal Cancer. [(accessed on 1 February 2019)]; Available online: https://www.cancer.org/cancer/colon-rectal-cancer/about/key-statistics.h....
-
- Kelty E., Ward S.V., Cadby G., McCarthy N.S., O’Leary P., Moses E.K., Ee H.C., Preen D.B. Familial and non-familial risk factors associated with incidence of colorectal cancer in young and middle-aged persons in Western Australia. Cancer Epidemiol. 2019;62:101591. doi: 10.1016/j.canep.2019.101591. - DOI - PubMed
Grants and funding
LinkOut - more resources
Full Text Sources
Research Materials
Miscellaneous
