From bud formation to flowering: transcriptomic state defines the cherry developmental phases of sweet cherry bud dormancy
- PMID: 31830909
- PMCID: PMC6909552
- DOI: 10.1186/s12864-019-6348-z
From bud formation to flowering: transcriptomic state defines the cherry developmental phases of sweet cherry bud dormancy
Abstract
Background: Bud dormancy is a crucial stage in perennial trees and allows survival over winter to ensure optimal flowering and fruit production. Recent work highlighted physiological and molecular events occurring during bud dormancy in trees. However, they usually examined bud development or bud dormancy in isolation. In this work, we aimed to further explore the global transcriptional changes happening throughout bud development and dormancy onset, progression and release.
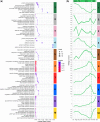
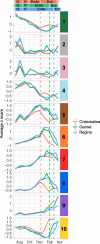
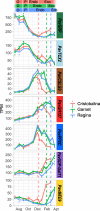
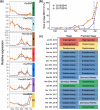
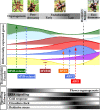
Results: Using next-generation sequencing and modelling, we conducted an in-depth transcriptomic analysis for all stages of flower buds in several sweet cherry (Prunus avium L.) cultivars that are characterized for their contrasted dates of dormancy release. We find that buds in organogenesis, paradormancy, endodormancy and ecodormancy stages are defined by the expression of genes involved in specific pathways, and these are conserved between different sweet cherry cultivars. In particular, we found that DORMANCY ASSOCIATED MADS-box (DAM), floral identity and organogenesis genes are up-regulated during the pre-dormancy stages while endodormancy is characterized by a complex array of signalling pathways, including cold response genes, ABA and oxidation-reduction processes. After dormancy release, genes associated with global cell activity, division and differentiation are activated during ecodormancy and growth resumption. We then went a step beyond the global transcriptomic analysis and we developed a model based on the transcriptional profiles of just seven genes to accurately predict the main bud dormancy stages.
Conclusions: Overall, this study has allowed us to better understand the transcriptional changes occurring throughout the different phases of flower bud development, from bud formation in the summer to flowering in the following spring. Our work sets the stage for the development of fast and cost effective diagnostic tools to molecularly define the dormancy stages. Such integrative approaches will therefore be extremely useful for a better comprehension of complex phenological processes in many species.
Keywords: Prediction; Prunus avium L.; RNA sequencing; Seasonal timing; Time course; Transcriptomic.
Conflict of interest statement
The authors declare that they have no competing interests.
Figures




Similar articles
-
Meta-analysis of RNA-Seq studies reveals genes with dominant functions during flower bud endo- to eco-dormancy transition in Prunus species.Sci Rep. 2021 Jun 23;11(1):13173. doi: 10.1038/s41598-021-92600-6. Sci Rep. 2021. PMID: 34162991 Free PMC article.
-
Comparative transcriptomic analysis reveals novel roles of transcription factors and hormones during the flowering induction and floral bud differentiation in sweet cherry trees (Prunus avium L. cv. Bing).PLoS One. 2020 Mar 12;15(3):e0230110. doi: 10.1371/journal.pone.0230110. eCollection 2020. PLoS One. 2020. PMID: 32163460 Free PMC article.
-
The sweet cherry (Prunus avium) FLOWERING LOCUS T gene is expressed during floral bud determination and can promote flowering in a winter-annual Arabidopsis accession.Plant Reprod. 2016 Dec;29(4):311-322. doi: 10.1007/s00497-016-0296-4. Epub 2016 Nov 23. Plant Reprod. 2016. PMID: 27878597
-
I Want to (Bud) Break Free: The Potential Role of DAM and SVP-Like Genes in Regulating Dormancy Cycle in Temperate Fruit Trees.Front Plant Sci. 2019 Jan 10;9:1990. doi: 10.3389/fpls.2018.01990. eCollection 2018. Front Plant Sci. 2019. PMID: 30687377 Free PMC article. Review.
-
Bud endodormancy in deciduous fruit trees: advances and prospects.Hortic Res. 2021 Jun 1;8(1):139. doi: 10.1038/s41438-021-00575-2. Hortic Res. 2021. PMID: 34078882 Free PMC article. Review.
Cited by
-
Integrative Analysis of Gene Expression and miRNAs Reveal Biological Pathways Associated with Bud Paradormancy and Endodormancy in Grapevine.Plants (Basel). 2021 Mar 31;10(4):669. doi: 10.3390/plants10040669. Plants (Basel). 2021. PMID: 33807184 Free PMC article.
-
Meta-analysis of RNA-Seq studies reveals genes with dominant functions during flower bud endo- to eco-dormancy transition in Prunus species.Sci Rep. 2021 Jun 23;11(1):13173. doi: 10.1038/s41598-021-92600-6. Sci Rep. 2021. PMID: 34162991 Free PMC article.
-
Identification of Key Genes Related to Dormancy Control in Prunus Species by Meta-Analysis of RNAseq Data.Plants (Basel). 2022 Sep 21;11(19):2469. doi: 10.3390/plants11192469. Plants (Basel). 2022. PMID: 36235335 Free PMC article.
-
ABA and Not Chilling Reduces Heat Requirement to Force Cherry Blossom after Endodormancy Release.Plants (Basel). 2022 Aug 4;11(15):2044. doi: 10.3390/plants11152044. Plants (Basel). 2022. PMID: 35956522 Free PMC article.
-
Flowering time runs hot and cold.Plant Physiol. 2022 Aug 29;190(1):5-18. doi: 10.1093/plphys/kiac111. Plant Physiol. 2022. PMID: 35274728 Free PMC article. Review.
References
-
- Allona I, Ramos A, Ibáñez C, Contreras A, Casado R, Aragoncillo C. Review. Molecular control of winter dormancy establishment in trees. Span J Agric Res. 2008;6:201–210. doi: 10.5424/sjar/200806S1-389. - DOI
MeSH terms
Substances
LinkOut - more resources
Full Text Sources
Other Literature Sources
Molecular Biology Databases

