Expression of LGR5, FZD7, TROY, and MIST1 in Perioperatively Treated Gastric Carcinomas and Correlation with Therapy Response
- PMID: 31827644
- PMCID: PMC6885822
- DOI: 10.1155/2019/8154926
Expression of LGR5, FZD7, TROY, and MIST1 in Perioperatively Treated Gastric Carcinomas and Correlation with Therapy Response
Abstract
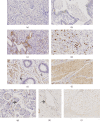
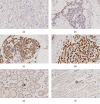
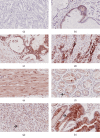
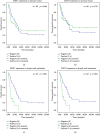
The cancer stem cell model is considered as a putative cause of resistance to chemotherapy and disease recurrence in malignant tumors. In this study, we tested the hypothesis that the response to neoadjuvant/perioperative chemotherapy correlates with the expression of four different putative cancer stem cell markers of gastric cancer (GC), i.e., LGR5, FZD7, TROY, and MIST1. The expression of LGR5, FZD7, TROY, and MIST1 was assessed by immunohistochemistry in 119 perioperatively treated GCs including pretherapeutic biopsies, resected primary GCs, and corresponding nodal and distant metastases. All four markers were detected in our cohort with variable prevalence and histoanatomical distributions. Few tumor cells expressed TROY. LGR5, FZD7, and MIST1 were coexpressed in 41.2% and completely absent in 6.2%. The prevalence of LGR5- and FZD7-positive GCs was higher and of TROY-positive GCs lower in perioperatively treated GCs compared with treatment-naïve tumors. LGR5, FZD7, and MIST1 in the primary tumors correlated significantly with their expression in the corresponding lymph node metastasis. An increased expression of LGR5 in primary GC correlated significantly with tumor regression. The expression of MIST1 in lymph node metastases correlated significantly with the number of lymph node metastases as well as overall and tumor-specific survival. FZD7 did not correlate with any clinicopathological patient characteristic. Our study on clinical patient samples shows that GCs may coexpress independently different stem cell markers; that neoadjuvant/perioperative treatment of GC significantly impacts on the expression of stem cell markers, which cannot be predicted by the analysis of pretherapeutic biopsies; and that their expression and tumor biological effect are heterogeneous and have to be viewed as a function of histoanatomical distribution.
Copyright © 2019 Antonia Freiin Grote et al.
Conflict of interest statement
The authors declare no conflict of interest.
Figures


Similar articles
-
Prognostic significance of leucine-rich-repeat-containing G-protein-coupled receptor 5, an intestinal stem cell marker, in gastric carcinomas.Gastric Cancer. 2016 Jul;19(3):767-77. doi: 10.1007/s10120-015-0543-7. Epub 2015 Sep 19. Gastric Cancer. 2016. PMID: 26386561
-
LGR5 and CD133 as prognostic and predictive markers for fluoropyrimidine-based adjuvant chemotherapy in colorectal cancer.Acta Oncol. 2016 Dec;55(12):1425-1433. doi: 10.1080/0284186X.2016.1201215. Epub 2016 Jul 20. Acta Oncol. 2016. PMID: 27435662 Clinical Trial.
-
Expression profile of intestinal stem cell and cancer stem cell markers in gastric cancers with submucosal invasion.Pathol Res Pract. 2021 Feb;218:153336. doi: 10.1016/j.prp.2020.153336. Epub 2021 Jan 2. Pathol Res Pract. 2021. PMID: 33450435
-
[Ways to personalized medicine for gastric cancer].Pathologe. 2013 Sep;34(5):403-12. doi: 10.1007/s00292-013-1785-y. Pathologe. 2013. PMID: 23907566 Review. German.
-
Stem cells in gastric cancer.World J Gastroenterol. 2015 Jan 7;21(1):112-23. doi: 10.3748/wjg.v21.i1.112. World J Gastroenterol. 2015. PMID: 25574084 Free PMC article. Review.
Cited by
-
Wnt signaling in gastric cancer: current progress and future prospects.Front Oncol. 2024 Jun 7;14:1410513. doi: 10.3389/fonc.2024.1410513. eCollection 2024. Front Oncol. 2024. PMID: 38952556 Free PMC article. Review.
-
Clinical Implications and Prognostic Value of Leucine-Rich G Protein-Coupled Receptor 5 Expression as A Cancer Stem Cell Marker in Malignancies: A Systematic Review and Meta-Analysis.Cell J. 2024 Jan 31;26(1):1-12. doi: 10.22074/cellj.2023.2010157.1396. Cell J. 2024. PMID: 38351725 Free PMC article.
-
Impact of Cancer Stem Cells on Therapy Resistance in Gastric Cancer.Cancers (Basel). 2022 Mar 11;14(6):1457. doi: 10.3390/cancers14061457. Cancers (Basel). 2022. PMID: 35326607 Free PMC article. Review.
-
Role of Frizzled receptor expression on patients' survival with gastrointestinal cancers: A systematic review with meta-analysis.Caspian J Intern Med. 2022 Winter;13(1):1-9. doi: 10.22088/cjim.13.1.1. Caspian J Intern Med. 2022. PMID: 35178201 Free PMC article. Review.
References
-
- Ferlay J. S. E. M., Soerjomataram I., Ervik M., et al. GLOBOCAN 2012 v1. 0. Cancer Incidence and Mortality Worldwide: IARC CancerBase. 2013;11
-
- Kaatsch P., Spix C., Katalinic A., Hentschel S., Luttmann S., Stegmaier C. Krebs in Deutschland für 2013/2014. Berlin: Robert Koch-Institut; 2017.
-
- Al-Batran S. E., Homann N., Pauligk C., et al. Effect of neoadjuvant chemotherapy followed by surgical resection on survival in patients with limited metastatic gastric or gastroesophageal junction cancer: the AIO-FLOT3 trial. JAMA Oncology. 2017;3(9):1237–1244. doi: 10.1001/jamaoncol.2017.0515. - DOI - PMC - PubMed
MeSH terms
Substances
LinkOut - more resources
Full Text Sources
Medical
Molecular Biology Databases
Miscellaneous

