

Development and Validation of an IDH1-Associated Immune Prognostic Signature for Diffuse Lower-Grade Glioma
- PMID: 31824866
- PMCID: PMC6883600
- DOI: 10.3389/fonc.2019.01310
Development and Validation of an IDH1-Associated Immune Prognostic Signature for Diffuse Lower-Grade Glioma
Abstract
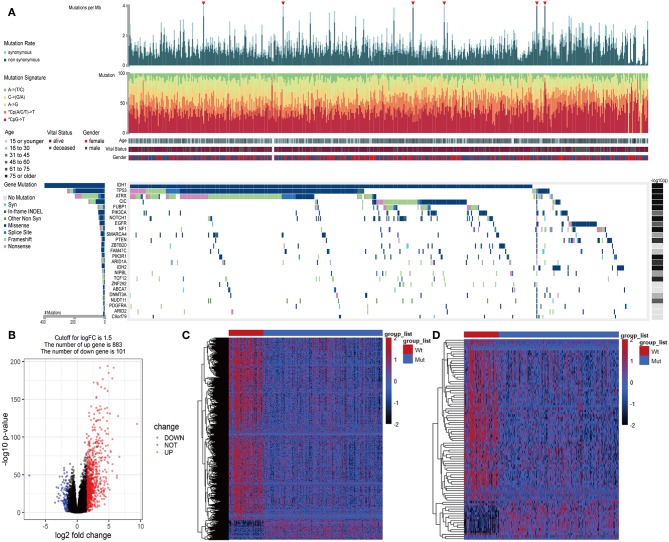
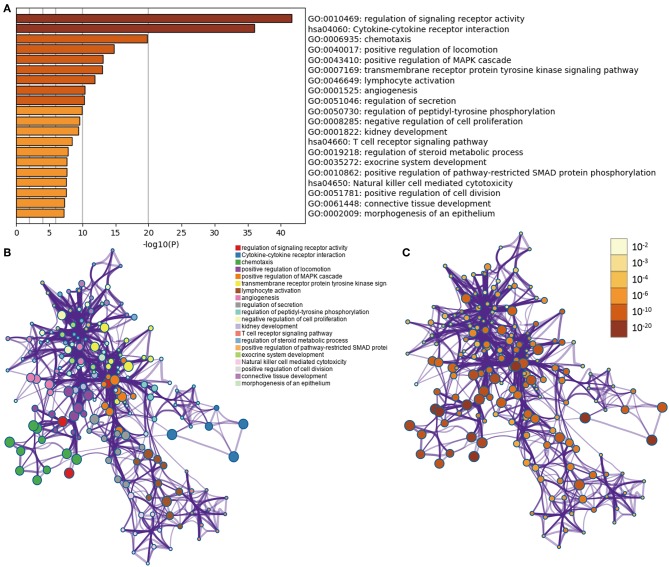
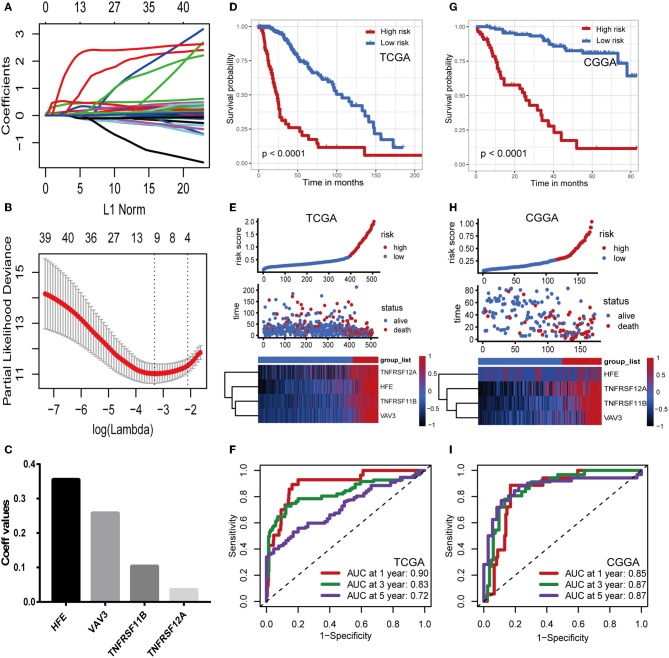
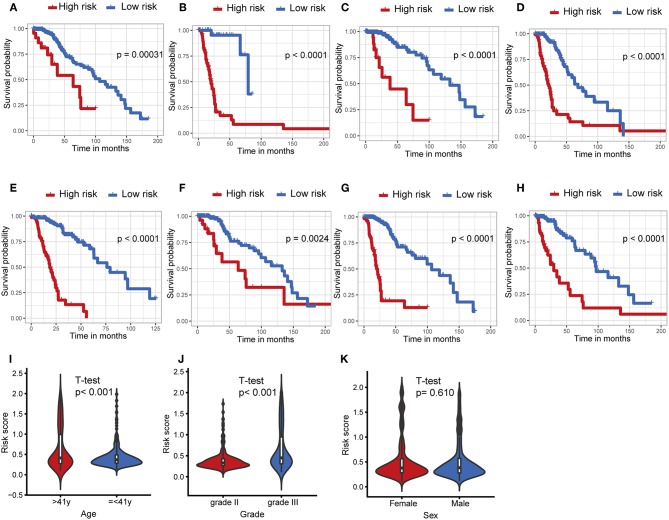
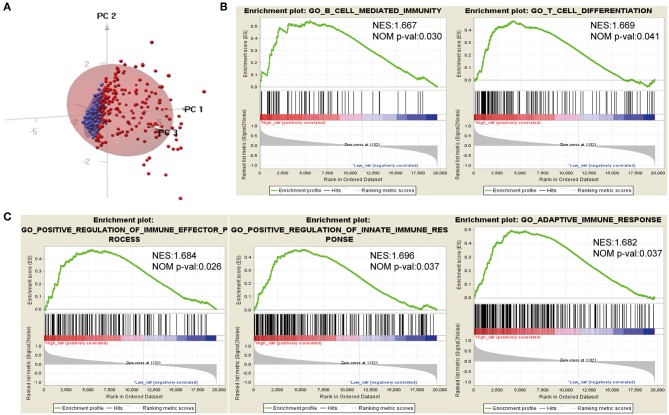
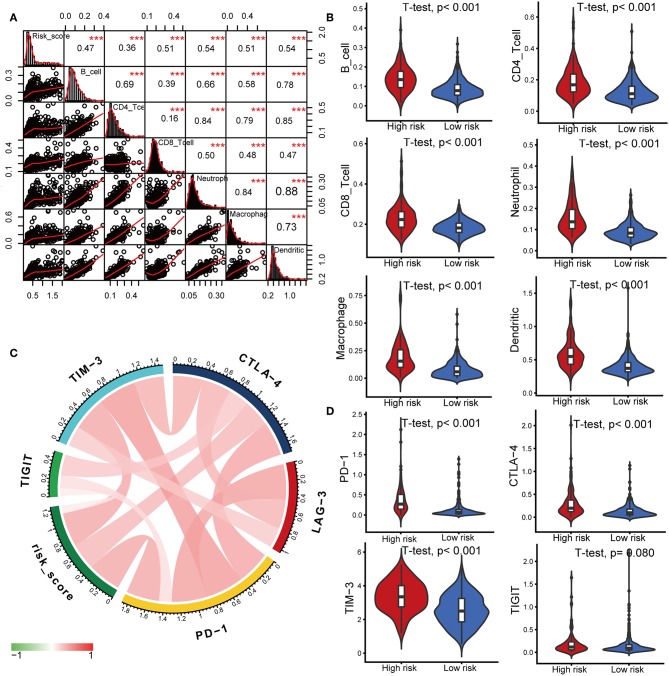
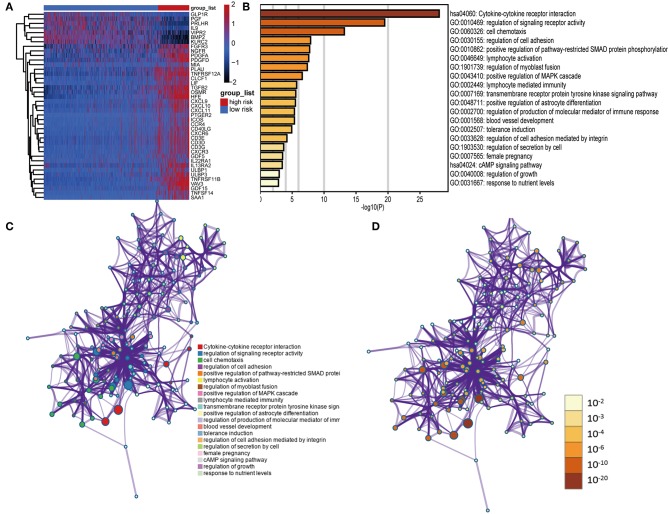
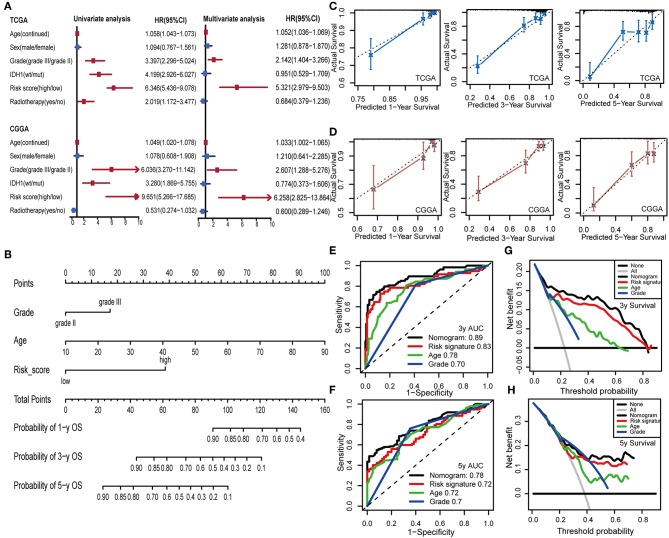
A mutation in the isocitrate dehydrogenase 1 (IDH1) gene is the most common mutation in diffuse lower-grade gliomas (LGGs), and it is significantly related to the prognosis of LGGs. We aimed to explore the influence of the IDH1 mutation on the immune microenvironment and develop an IDH1-associated immune prognostic signature (IPS) for predicting prognosis in LGGs. IDH1 mutation status and RNA expression were investigated in two different public cohorts. To develop an IPS, LASSO Cox analysis was conducted for immune-related genes that were differentially expressed between IDH1wt and IDH1mut LGG patients. Then, we systematically analyzed the influence of the IPS on the immune microenvironment. A total of 41 immune prognostic genes were identified based on the IDH1 mutation status. A four-gene IPS was established and LGG patients were effectively stratified into low- and high-risk groups in both the training and validation sets. Stratification analysis and multivariate Cox analysis revealed that the IPS was an independent prognostic factor. We also found that high-risk LGG patients had higher levels of infiltrating B cells, CD4+ T cells, CD8+ T cells, neutrophils, macrophages and dendritic cells, and expressed higher levels of CTLA-4, PD-1 and TIM-3. Moreover, a novel nomogram model was established to estimate the overall survival in LGG patients. The current study provides novel insights into the LGG immune microenvironment and potential immunotherapies. The proposed IPS is a clinically promising biomarker that can be used to classify LGG patients into subgroups with distinct outcomes and immunophenotypes, with the potential to facilitate individualized management and improve prognosis.
Keywords: IDH1; immune prognostic signature; lower-grade glioma; mutation; nomogram.
Copyright © 2019 Deng, Lin, Chen, Zhang, Xu, Yang, Shen, Yang, Lu, Sheng, Yin, Zhang and Lin.
Figures
Similar articles
-
Development and Validation of a Tumor Mutation Burden-Related Immune Prognostic Model for Lower-Grade Glioma.Front Oncol. 2020 Aug 20;10:1409. doi: 10.3389/fonc.2020.01409. eCollection 2020. Front Oncol. 2020. PMID: 32974146 Free PMC article.
-
Systematic identification, development, and validation of prognostic biomarkers involving the tumor-immune microenvironment for glioblastoma.J Cell Physiol. 2021 Jan;236(1):507-522. doi: 10.1002/jcp.29878. Epub 2020 Jun 22. J Cell Physiol. 2021. PMID: 32572951
-
Gene Expression Profiling Stratifies IDH1-Mutant Glioma with Distinct Prognoses.Mol Neurobiol. 2017 Oct;54(8):5996-6005. doi: 10.1007/s12035-016-0150-6. Epub 2016 Sep 30. Mol Neurobiol. 2017. PMID: 27696222
-
IDH1 mutation is associated with a higher preoperative seizure incidence in low-grade glioma: A systematic review and meta-analysis.Seizure. 2018 Feb;55:76-82. doi: 10.1016/j.seizure.2018.01.011. Epub 2018 Jan 31. Seizure. 2018. PMID: 29414139 Review.
-
Molecular features assisting in diagnosis, surgery, and treatment decision making in low-grade gliomas.Neurosurg Focus. 2015 Mar;38(3):E2. doi: 10.3171/2015.1.FOCUS14745. Neurosurg Focus. 2015. PMID: 25727224 Review.
Cited by
-
Identification of a three-long noncoding RNA prognostic model involved competitive endogenous RNA in kidney renal clear cell carcinoma.Cancer Cell Int. 2020 Jul 17;20:319. doi: 10.1186/s12935-020-01423-4. eCollection 2020. Cancer Cell Int. 2020. PMID: 32694941 Free PMC article.
-
Clinical significance for diagnosis and prognosis of POP1 and its potential role in breast cancer: a comprehensive analysis based on multiple databases.Aging (Albany NY). 2022 Sep 9;14(17):6936-6956. doi: 10.18632/aging.204255. Epub 2022 Sep 9. Aging (Albany NY). 2022. PMID: 36084948 Free PMC article.
-
NSUN5/TET2-directed chromatin-associated RNA modification of 5-methylcytosine to 5-hydroxymethylcytosine governs glioma immune evasion.Proc Natl Acad Sci U S A. 2024 Apr 2;121(14):e2321611121. doi: 10.1073/pnas.2321611121. Epub 2024 Mar 28. Proc Natl Acad Sci U S A. 2024. PMID: 38547058 Free PMC article.
-
Development of a Prognostic Five-Gene Signature for Diffuse Lower-Grade Glioma Patients.Front Neurol. 2021 Jul 6;12:633390. doi: 10.3389/fneur.2021.633390. eCollection 2021. Front Neurol. 2021. PMID: 34295296 Free PMC article.
-
A 1p/19q Codeletion-Associated Immune Signature for Predicting Lower Grade Glioma Prognosis.Cell Mol Neurobiol. 2022 Apr;42(3):709-722. doi: 10.1007/s10571-020-00959-3. Epub 2020 Sep 7. Cell Mol Neurobiol. 2022. PMID: 32894375 Free PMC article.
References
LinkOut - more resources
Full Text Sources
Research Materials
Miscellaneous