. 2019 Nov 25:10:2665.
doi: 10.3389/fimmu.2019.02665. eCollection 2019.

T Regulatory Cells From Non-obese Diabetic Mice Show Low Responsiveness to IL-2 Stimulation and Exhibit Differential Expression of Anergy-Related and Ubiquitination Factors

Affiliations

T Regulatory Cells From Non-obese Diabetic Mice Show Low Responsiveness to IL-2 Stimulation and Exhibit Differential Expression of Anergy-Related and Ubiquitination Factors

Gloria J Godoy et al. Front Immunol. .

Abstract

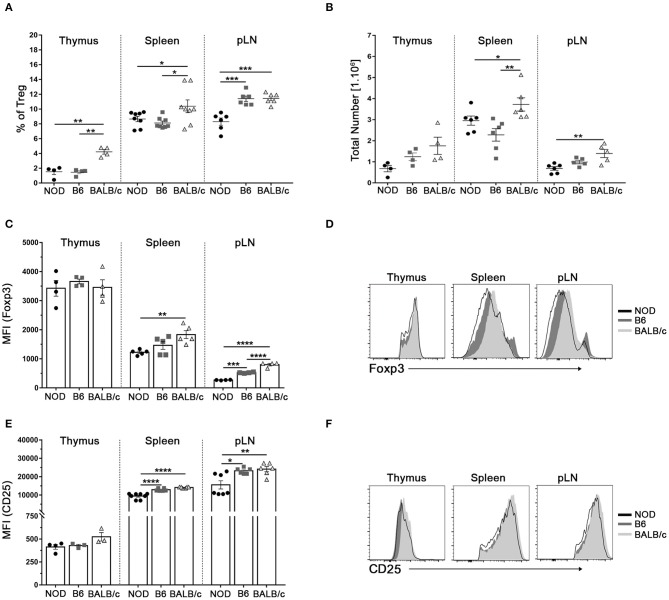
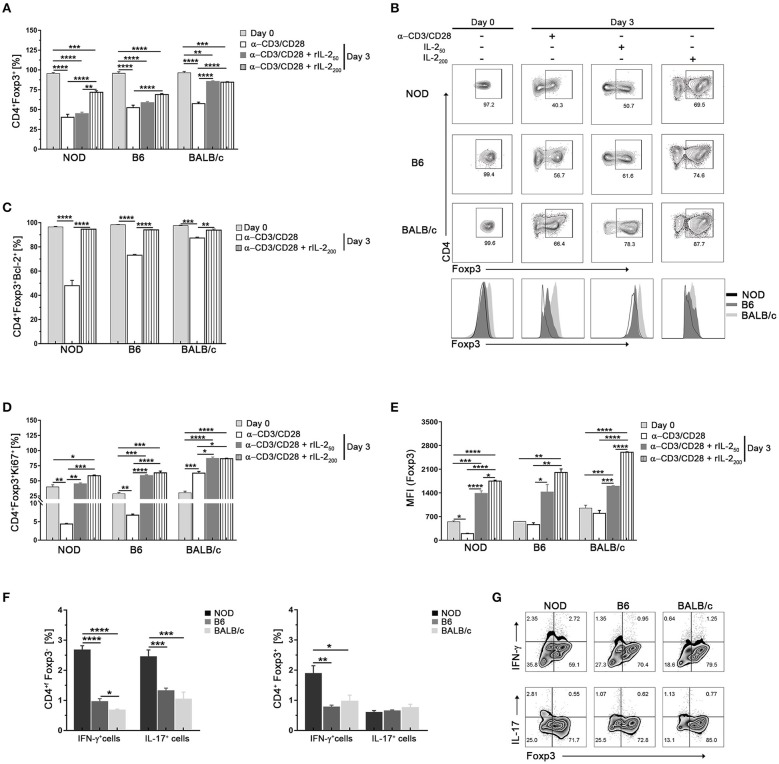
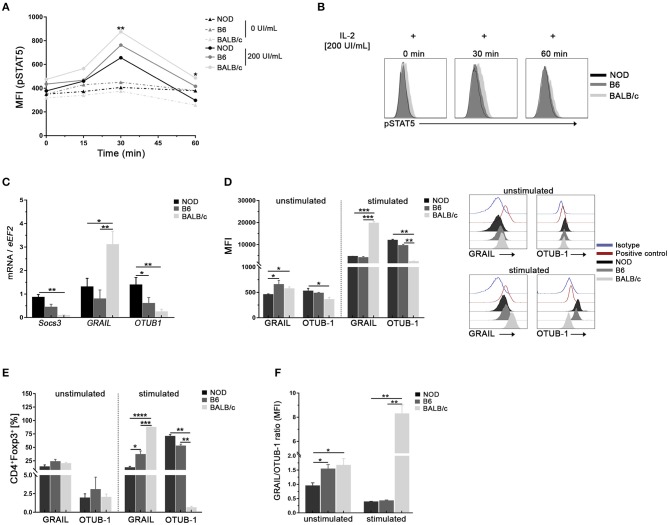
Foxp3+ Regulatory T cells (Tregs) are pivotal for the maintenance of tolerance. Alterations in their number and/or function have been proposed to occur in the autoimmune-prone non-obese diabetic (NOD) mouse. Comparing the frequencies and absolute numbers of CD4+Foxp3+CD25+ Tregs among 4 to 6-week old NOD, B6, and BALB/c mice, we observed differences in counts and Foxp3 expression in Tregs from secondary lymphoid organs, but not in the thymus. Upon TCR and IL-2 stimulation, NOD Tregs showed lower responses than Tregs from B6 and BALB/c mice. Indeed, NOD Tregs responded with less proliferation and with smaller increments in the expression of CD25, LAP-1, CD39, PD-1, PD-L1, and LAG-3, when in vitro cultured for 3 days with anti-CD3/CD28 in the absence or presence of IL-2, Tregs from NOD mice showed to be highly dependent on IL-2 to maintain Foxp3 expression. Moreover, NOD Tregs become producers of IL-17 and INF-gamma more easily than Tregs from the other strains. In addition, NOD Tregs showed lower responsiveness to IL-2, with significantly reduced levels of pSTAT5, even at high IL-2 doses, with respect to B6 and BALB/c Tregs. Interestingly, NOD Tregs exhibit differences in the expression of SOCS3, GRAIL, and OTUB1 when compared with Tregs from B6 and BALB/c mice. Both, at steady state conditions and also after activation, Tregs from NOD mice showed increased levels of OTUB1 and low levels of GRAIL. In addition, NOD Tregs had differences in the expression of ubiquitin related molecules that play a role in the maintenance of Foxp3 cellular pools. Indeed, significantly higher STUB1/USP7 ratios were detected in NOD Tregs, both at basal conditions and after stimulation, compared to in B6 and BALB/c Tregs. Moreover, the addition of a proteasome inhibitor to cell cultures, conferred NOD Tregs the ability to retain Foxp3 expression. Herein, we provide evidence indicating a differential expression of SOCS3, GRAIL, and STUB1/USP7 in Tregs from NOD mice, factors known to be involved in IL-2R signaling and to affect Foxp3 stability. These findings add to the current knowledge of the immunobiology of Tregs and may be related to the known insufficiency of Tregs from NOD mice to maintain self-tolerance.

Keywords: GRAIL; IL-2 signaling; NOD mice; STUB1; USP7; regulatory T cells.


Figures

Figure 1
Figure 1
Reduced Treg cell counts and Tregs Foxp3/CD25 expression in NOD mice. (A) Scatter plots show the frequency of Foxp3+CD4+CD25+ (Treg) cells in the CD4+ live cell population of the thymus, spleen, and a pool of inguinal and popliteal lymph nodes (pLN) from 4 to 6-week old NOD, B6, and BALB/c mice. (B) Absolute numbers of Treg cells in the thymus, spleen, and pLN from NOD, B6, and BALB/c mice. (C) Bar graph showing Mean Fluorescence Intensity (MFI) values for Foxp3 in Tregs from the thymus, spleen, and pLN from NOD, B6, and BALB/c mice. (D) Representative histograms of Foxp3 expression in Tregs from the thymus, spleen, and pLN in all strains under study. (E) Bar graph showing MFI values for CD25 in Tregs from the thymus, spleen, and pLN from NOD, B6, and BALB/c mice. (F) Representative histograms of CD25 expression on CD4+ cells from the thymus, spleen, and pLN in all the mouse strains under study. Gates were performed on viable cells using Live-dead fixable (Invitrogen) dye and Fluorescence Minus One (FMO) controls. Data are shown as mean ± SEM, n = 4–8 mice per group, and are representative of three independent experiments with essentially the same results. The p-values were obtained using one-way ANOVA followed by Bonferroni post-hoc analysis as appropriate. *p < 0.05, **p < 0.01, ***p < 0.001, and ****p < 0.0001.
Figure 2
Figure 2
Tregs from NOD mice show low responsiveness to TCR plus IL-2 stimulation. (A) Representative histograms of CD25, GIRT, CD73, CD39, LAP-1, PD-1, PD-L1, and LAG-3 expression in purified splenic Treg (CD4+CD25hi) cells from NOD, B6, and BALB/c mice without stimulation and after αCD3/CD28 plus rIL-2 stimulation (100 UI/ml). (B) Bar graph showing values of MFI fold change relative to values found in purified unstimulated Tregs from the mouse strains under study. (C) Bar graph showing values of Ki67+ Tregs percentage fold change relative to values found in unstimulated Tregs from the mouse strains under study. Gates were performed on viable cells using Live-dead fixable (Invitrogen) dye and Fluorescence Minus One (FMO) controls. To purify Tregs, 12 mice per mouse strain were used. Data correspond to at least four replicates (mean ± SEM) of a single sample for each condition and mouse strain analyzed. The analysis is representative of at least three independent experiments with essentially the same results. The p-values were obtained using one-way ANOVA followed by Bonferroni post-hoc analysis as appropriate. *p < 0.05 and **p < 0.01.
Figure 3
Figure 3
Tregs from NOD mice show less in vitro stability in conditions of low IL-2 abundance. (A) Bar graph showing the frequencies of Foxp3+CD4+ cells at days 0 and 3 after stimulation with αCD3/CD28 in the absence or presence of rIL-2 (50–200 UI/ml). (B) Representative contour plots and histograms of Foxp3 expression in sorted splenic Treg (CD4+CD25hi) cells from NOD, B6, and BALB/c mice at day 0 and after 3 days of stimulation with αCD3/CD28 in the absence or presence of rIL-2. (C) Bar graph showing the frequency values of CD4+Foxp3+Bcl-2+ cells at days 0 and 3 after stimulation with αCD3/CD28 in the absence or presence of rIL-2 (200 UI/ml). (D) Bar graphs showing the frequencies of CD4+Foxp3+Ki67+ cells at days 0 and 3 after stimulation with αCD3/CD28 in the absence or presence of rIL-2 (50–200 UI/ml). (E) Bar graph showing MFI values for Foxp3 in CD4+Foxp3+ cells at days 0 and 3 after stimulation with αCD3/CD28 in the absence or presence of rIL-2 (50–200 UI/ml). (F) Bar graphs showing the frequencies values of CD4+Foxp3 (non-Tregs) and CD4+Foxp3+ (Tregs) expressing IL-17+ and INF-γ+ cells after 3 days of culture with αCD3/CD28 plus rIL-2 (200 UI/ml). (G) Representative contour plots showing the frequencies of CD4+Foxp3+ and CD4+Foxp3 cells producing IFN-γ and IL-17 after 3 days of culture with αCD3/CD28 plus rIL-2 (200 UI/ml). Gates were performed on viable CD4+ cells using Live-dead fixable (Invitrogen) dye and Fluorescence Minus One (FMO) controls. To purify Tregs, 12 mice per strain were used. Data correspond to at least four replicates (mean ± SEM) of a single sample for each condition and mouse strain analyzed. The analysis is representative of at least three independent experiments with essentially the same results. The p-values were obtained using one-way ANOVA followed by Bonferroni post-hoc analysis as appropriate. *p < 0.05, **p < 0.01, ***p < 0.001, and ****p < 0.0001.
Figure 4
Figure 4
Tregs from NOD mice show low responsiveness to IL-2 stimulation and exhibit differences in the expression of SOCS3, GRAIL, and OTUB1. (A) Mean Fluorescence Intensity for pSTAT5 after 0, 30, and 60 min of stimulation with or without rIL-2 (200 UI/ml). Values in the absence of IL-2 for all time-points are represented by dotted lines. (B) Representative histograms of pSTAT5 expression in sorted splenic Treg (CD4+CD25hi) cells from NOD, B6, and BALB/c mice after 0, 30, and 60 min of stimulation with rIL-2 (200 UI/ml). (C) Bar graphs of mRNA for SOCS3, GRAIL, and OTUB1 from sorted splenic Tregs from NOD, B6, and BALB/c mice. (D) Bar graphs (left) and representative histograms (right) showing MFI for GRAIL and OTUB1 in purified splenic Tregs from NOD, B6, and BALB/c mice, unstimulated or stimulated with rIL-2 during 30 min. (E) Bar graphs showing frequencies of GRAIL+ and OTUB1+ cells in unstimulated and rIL-2 stimulated Tregs from NOD, B6, and BALB/c mice (30 min). (F) GRAIL/OTUB1 MIF ratios in unstimulated and stimulated Tregs from NOD, B6, and BALB/c mice. To purify Tregs, 12 mice per strain were used. Data correspond to at least four replicates (mean ± SEM) of a single sample for each condition and mouse strain analyzed. The analysis is representative of at least three independent experiments with essentially the same results. The p-values were obtained using one- and two-way ANOVA followed by Bonferroni post-hoc analysis as appropriate. *p < 0.05, **p < 0.01, ***p < 0.001, and ****p < 0.0001.
Figure 5
Figure 5
Tregs from NOD mice show high expression of ubiquitination related molecules. (A) Bar graphs of mRNA for STUB-1 and USP7 from sorted splenic Treg cells of NOD, B6, and BALB/c mice. (B) Bar graphs showing MFI for STUB-1 and USP7 in unstimulated and stimulated purified splenic Treg cells from NOD, B6 and BALB/c mice. (C) Representative histograms of STUB-1 and USP7 expression in unstimulated and αCD3/CD28 plus rIL-2 stimulated Treg cells from NOD, B6, and BALB/c mice (D) STUB-1/USP7 MFI ratio in unstimulated and stimulated Treg cells from NOD, B6 and BALB/c mice. (E) Frequencies (left) and representative contour plots (right) of purified Treg cells in vitro stimulated with αCD3/CD28 plus or without rIL-2 for 3 days, and in the absence or presence of the proteasome inhibitor MG-132. The proteasome inhibitor MG-132 was added at a concentration of 5 μM during the last 12 h of the culture. (F) STUB-1/USP7 MFI ratios of CD4+Foxp3+ Treg cells from NOD, B6, and BALB/c mice after 3 days of stimulation with rIL-2 plus rIL-6 or rIFN-γ. To purify Tregs, 12 mice per strain were used. Data correspond to at least four replicates (mean ± SEM) of a single sample for each condition and mouse strain analyzed. The analysis is representative of at least three independent experiments with essentially the same results. The p-values were obtained using one-way ANOVA followed by Bonferroni post-hoc analysis as appropriate. *p < 0.05, **p < 0.01, ***p < 0.001, and ****p < 0.0001.

Similar articles

Cited by

References

    1. Dendrou C, Wicker L. The IL-2/CD25 pathway determines susceptibility to T1D in humans and NOD mice. J Clin Immunol. (2008) 28:685–96. 10.1007/s10875-008-9237-9 - DOI - PubMed
    1. Ramsdell F, Ziegler SF. FOXP3 and scurfy: how it all began. Nat Rev Immunol. (2014) 14:343–9. 10.1038/nri3650 - DOI - PubMed
    1. Shevach EM. Foxp3+T regulatory cells: still many unanswered Questions-A perspective after 20 years of study. Front Immunol. (2018) 9:1048. 10.3389/fimmu.2018.01048 - DOI - PMC - PubMed
    1. Visperas A, Vignali DAA. Are regulatory T cells defective in type 1 Diabetes and can we fix them? J Immunol. (2016) 197:3762–70. 10.4049/jimmunol.1601118 - DOI - PMC - PubMed
    1. You S, Cobbold S, Alyanakian M, Gouarin C, Barriot S, Garcia C, et al. . Autoimmune Diabetes onset results from qualitative rather than quantitative age-dependent changes in pathogenic T-cells. Diabetes. (2005) 54:1415–22. 10.2337/diabetes.54.5.1415 - DOI - PubMed

Publication types