. 2019 Dec 9;9(1):18594.
doi: 10.1038/s41598-019-55017-w.

Terminal Schwann cell and vacant site mediated synapse elimination at developing neuromuscular junctions

Affiliations

Terminal Schwann cell and vacant site mediated synapse elimination at developing neuromuscular junctions

Jae Hoon Jung et al. Sci Rep. .

Abstract

Synapses undergo transition from polyinnervation by multiple axons to single innervation a few weeks after birth. Synaptic activity of axons and interaxonal competition are thought to drive this developmental synapse elimination and tested as key parameters in quantitative models for further understanding. Recent studies of muscle synapses (endplates) show that there are also terminal Schwann cells (tSCs), glial cells associated with motor neurons and their functions, and vacant sites (or vacancies) devoid of tSCs and axons proposing tSCs as key effectors of synapse elimination. However, there is no quantitative model that considers roles of tSCs including vacancies. Here we develop a stochastic model of tSC and vacancy mediated synapse elimination. It employs their areas on individual endplates quantified by electron microscopy-based analyses assuming that vacancies form randomly and are taken over by adjacent axons or tSCs. The model reliably reproduced synapse elimination whereas equal or random probability models, similar to classical interaxonal competition models, did not. Furthermore, the model showed that synapse elimination is accelerated by enhanced synaptic activity of one axon and also by increased areas of vacancies and tSCs suggesting that the areas are important structural correlates of the rate of synapse elimination.


Conflict of interest statement

The authors declare no competing interests.

Figures

Figure 1
Figure 1
Developing sternomastoid NMJs at P0, P3, P7, and P16. (a,c,e,g) Montaged 2D electron micrographs spanning the entire NMJs in individual thin sections of mouse sternomastoid muscle fibers at P0, P3, P7, and P16, respectively. The nerve terminals of the NMJs contain synaptic vesicles and come within ~50 nm of the surface of a muscle fiber (M). The endplate on the muscle fiber is occupied by  tSCs (green dotted line), vacancies (black dotted line), and axons (dotted line in color different from green and black). Note that the postsynaptic membranes at P0 and P3 are smooth but show multiple indentations called junctional folds (JFs) at P7 and P16. Multiple axons at the NMJs are also associated with tSCs; vacancies are present, some of which extend to the surfaces of the muscle fibers. (b,d,f,h) Segmentation of the muscle fiber surfaces (red), terminals of axons (here in shades of blue), tSCs (green), and vacancies at the same NMJs. Red line represents the muscle fiber surface. Scale bar, 1 µm.
Figure 2
Figure 2
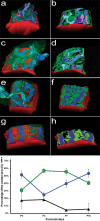
Surface models of axons of different neurons, tSCs, and vacancies at the NMJs and their contact areas on their endplate. (a,c,e,g) Surface rendering of a series of montaged electron micrographs of the sections of the same NMJs at P0, P3, P7, and P16, respectively. Axons, tSCs, and vacancies are color-coded in the same with Fig. 1. (b,d,f,h) The regions of the axons, tSCs, and vacancies in proximity to their muscle fiber or footprints at their endplate were segmented and using the series of their segmented lines the contact regions of the axons, tSCs, and vacancies were marked in color using the same color-code on their muscle fiber (red). (i) The average relative areas at P0, P3, P7, and P16. From P0 to P3, the relative contact area of tSCs in the endplate increased from 31.0% to 57.0% on average whereas that of axons decreased from 51.6% to 24.8% on average and also that the relative area of vacancies changed little (17.4% at P0 and 18.3% at P3 on average). The relative contact area of tSCs changed little from 57.0% at P3 to 55.6% at P7 and then decreased to 40.7% at P16. The relative contact area of vacancies markedly decreased from 18.3% at P3 to 4.55% at P7 and then changed little (5.82% at P16) whereas the relative contact area of axons significantly increased from 24.8% at P3 to 39.8% at P7 and then to 53.5% at P16.
Figure 3
Figure 3
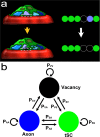
Schematic diagram of competing tSCs, vacancies, and axons. (a) An endplate covered with four different types of axon terminals (light blue, purple, cyan, and dark blue) and a tSC (green) transitions into an endplate covered with three of the axon terminals after removal of one axon terminal from the four and a vacancy (black) that takes the  place of the removed axon. (b) Competition of tSCs, vacancies, and axons. A blue circle represents a synaptic site formed on a muscle fiber by an axon. A green circle represents a synaptic site formed on a muscle fiber by a terminal Schwann cell (tSC). A black circle represents a vacancy having no axon or tSC on a muscle fiber. All the three different synaptic sites can transition from one kind of synaptic sites to another. A contact site formed by an axon has three different transition probabilities: a probability of transitioning into a vacancy (PAV), a probability of transitioning into a tSC (PAS), and a probability of no transition (PAA = 1-PAV-PAS). Similarly, a contact site formed by a tSC has three different transition probabilities: a probability of transitioning into a vacancy (PSV), a probability of transitioning into an axon (PSA), and a probability of no transition (PSS = 1−PSA−PSV). A vacant site also has three different transition probabilities: a probability of transitioning into a tSC (PVS), a probability of transitioning into an axon (PVA), and a probability of no transition (PVV = 1−PVS−PVA).
Figure 4
Figure 4
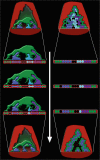
An example result based on a model of synaptic competition among axons, tSCs, and vacancies with random transition probabilities. (a) Initially, 9 different axons, tSCs and vacancies form their contact sites randomly in an endplate on a muscle fiber. The initial ratio of their total contact areas (axons:tSCs:vacancies) is about 30:16:54, which was determined from a previous serial electron microscopy study on developing muscle fibers of mouse during synapse elimination (See Methods). (b–h) The competition among axons, tSCs, and vacancies with their random transition probabilities shows elimination of multiple contact sites formed by different axons, tSCs, and vacancies at different iterations of the simulation (400, 500, 600, 700, 800, 1700, and 7600 iterations, respectively). (i) When the simulation reached 36500, synapse elimination is complete. However, only one type of axonal sites remains with no tSC and vacant sites that are present during and after synapse elimination of developing neuromuscular junctions. (j) The number of different types of contact sites in the endplate reduces sharply down to one as the iteration proceeds. (k) Change in the ratios of the contact areas formed by tSCs (green), vacancies (black), and 9 different axons (colors different from green and black) as the simulation based on a model of synaptic competition among axons, tSCs, and vacancies with random transition probabilities proceeds.
Figure 5
Figure 5
Schematic diagram of vacancy mediated competition between tSCs and axons. A model of competition between axonal and tSC sites assumes that tSC-axon competition to occupy the territory of the endplate is mediated by their adjacent vacancies. Accordingly, a synaptic site formed by an axon has two different transition probabilities: the probability of transitioning from an axonal site into a vacancy (PAV) and a probability of no transition (PAA = 1−PAV). Similarly, a synaptic contact site formed by a tSC has two different transition probabilities: a probability of transitioning into a vacancy (PSV) and a probability of no transition (PSS=1−PSV); a vacant site that are not an axonal site either a tSC site has two different transition probabilities: a probability of transitioning into an axon (PVA) and a probability of transitioning into a tSC (PVS = 1−PVA).
Figure 6
Figure 6
An example result based on a model of synaptic competition among axons, tSCs, and vacancies with different constant transition probabilities derived from the area ratios at P3 of the NMJs. Simulations carried out using the same configuration as described in Fig. 3, but the final ratios of tSCs, vacancies and axons are set to be 0.57, 0.18, and 0.25, respectively, which are the ratios at P3 of the NMJs. (a) Initially, 9 different axons, tSCs and vacancies form their contact sites randomly on a muscle fiber with the initial ratio of their total contact areas (axons:tSCs:vacancies), which is about 30:16:54 as Fig. 4. (b–h) The competition among axons, tSCs, and vacancies with their constant transition probabilities shows elimination of multiple contact sites formed by different axons, tSCs, and vacancies at different iterations of the simulation (100, 200, 300, 700, 1500, 3400, and 4100 iterations, respectively). (i) When the simulation is at 10,400 iterations, the competition leads to a complete synapse elimination with tSC and vacant sites present demonstrating that optimal transition probabilities reliably simulate synapse elimination. (j) The number of different types of axons in the endplate reduces sharply as the iteration proceeds. (k) Change in the ratios of the contact areas formed by tSCs (green), vacancies (black), and 9 different axons (colors different from green and black) as the simulation based on the stochastic model of tSC and vacancy mediated synapse elimination proceeds. Inset: the distribution of the least number of iterations when synapse elimination is complete from 100 repeated simulations.
Figure 7
Figure 7
Relationships of the simulated average least number of iterations to complete synapse elimination with different ratios of contact areas of tSCs, vacancies, and axons and with synaptic activity. (a) Measured average ratios of contact areas of tSCs (green), vacancies (black), and axons (blue) from each of the 8 different endplates at P3. (b) The average least number of iterations to complete synapse elimination for each of the measured ratios by repeating the simulations 100 times for each. Error bars are standard errors. (c) Negative correlation of the composite area of (a) with the least number of iteration to complete synapse elimination (Spearman correlation, p < 0.05). (d) Synaptic activity dependent synapse elimination. The simulation repeated 100 times as the number of active axons increased from 1 to 9. The average number of iterations to complete synapse elimination ratio obtained with the average ratio of the areas at P3 (57:18:25) was used as a reference rate of synapse elimination for comparison, and it is represented as a dotted line. When one to two different axons out of nine different axons in the endplate were active, synapse elimination accelerated. In contrast, when more than two different nerves were active, synapse elimination slowed down. Error bars are standard errors.
Figure 8
Figure 8
A stochastic model of tSC and vacancy mediated synapse elimination. According to the model, a vacant site or vacancy in an endplate of a muscle fiber forms randomly by a removing tSC or nerve terminal of an axon. The transition probability of a tSC to a vacancy and an axon to a vacancy are determined by measured relative areas of tSCs, vacancies, and axons. Subsequently, the vacancy is taken over by adjacent axons or tSCs. But the probability of its taking over by a specific axon is positively correlated with the axon’s relative contact area surrounding the vacancy. In other words, the greater the contact area of an axon surrounding the vacancy is, the greater the probability of its taking over the vacancy is. When the synaptic activity of an axon is greater than other axons in an endplate, the probability of the axon’s taking over is greater than other axons leading to acceleration of synapse elimination consistent with previous and other studies. Furthermore, our model newly predicts that as the relative area of the vacancy or tSC in an endplate increases synapse elimination speeds up raising a testable hypothesis that both the measurable relative areas of vacancies and tSCs are important structural correlates of the rate of synapse elimination.

Similar articles

Cited by

References

    1. Hall ZW, Sanes JR. Synaptic structure and development: the neuromuscular junction. Cell. 1993;72(Suppl):99–121. doi: 10.1016/S0092-8674(05)80031-5. - DOI - PubMed
    1. Sanes JR, Lichtman JW. Development of the vertebrate neuromuscular junction. Annu Rev Neurosci. 1999;22:389–442. doi: 10.1146/annurev.neuro.22.1.389. - DOI - PubMed
    1. Brown MC, Jansen JK, Van Essen D. Polyneuronal innervation of skeletal muscle in new-born rats and its elimination during maturation. J Physiol. 1976;261:387–422. doi: 10.1113/jphysiol.1976.sp011565. - DOI - PMC - PubMed
    1. Darabid H, Perez-Gonzalez AP, Robitaille R. Neuromuscular synaptogenesis: coordinating partners with multiple functions. Nat Rev Neurosci. 2014;15:703–718. doi: 10.1038/nrn3821. - DOI - PubMed
    1. Purves D, Lichtman JW. Elimination of synapses in the developing nervous system. Science. 1980;210:153–157. doi: 10.1126/science.7414326. - DOI - PubMed

Publication types