

Massively multiplex chemical transcriptomics at single-cell resolution
- PMID: 31806696
- PMCID: PMC7289078
- DOI: 10.1126/science.aax6234
Massively multiplex chemical transcriptomics at single-cell resolution
Abstract
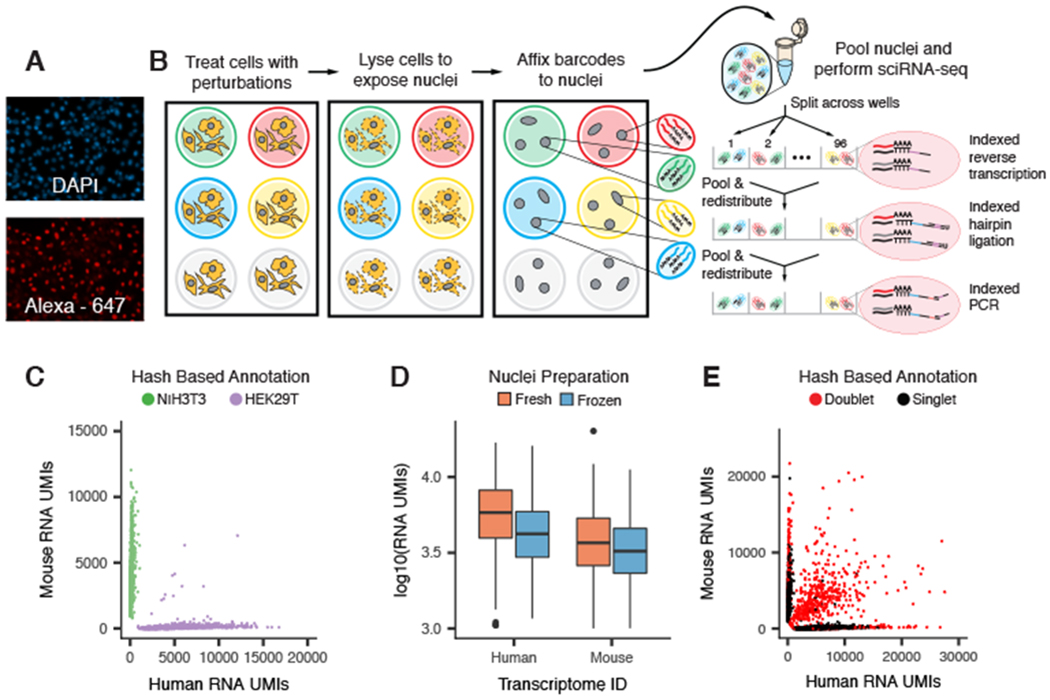
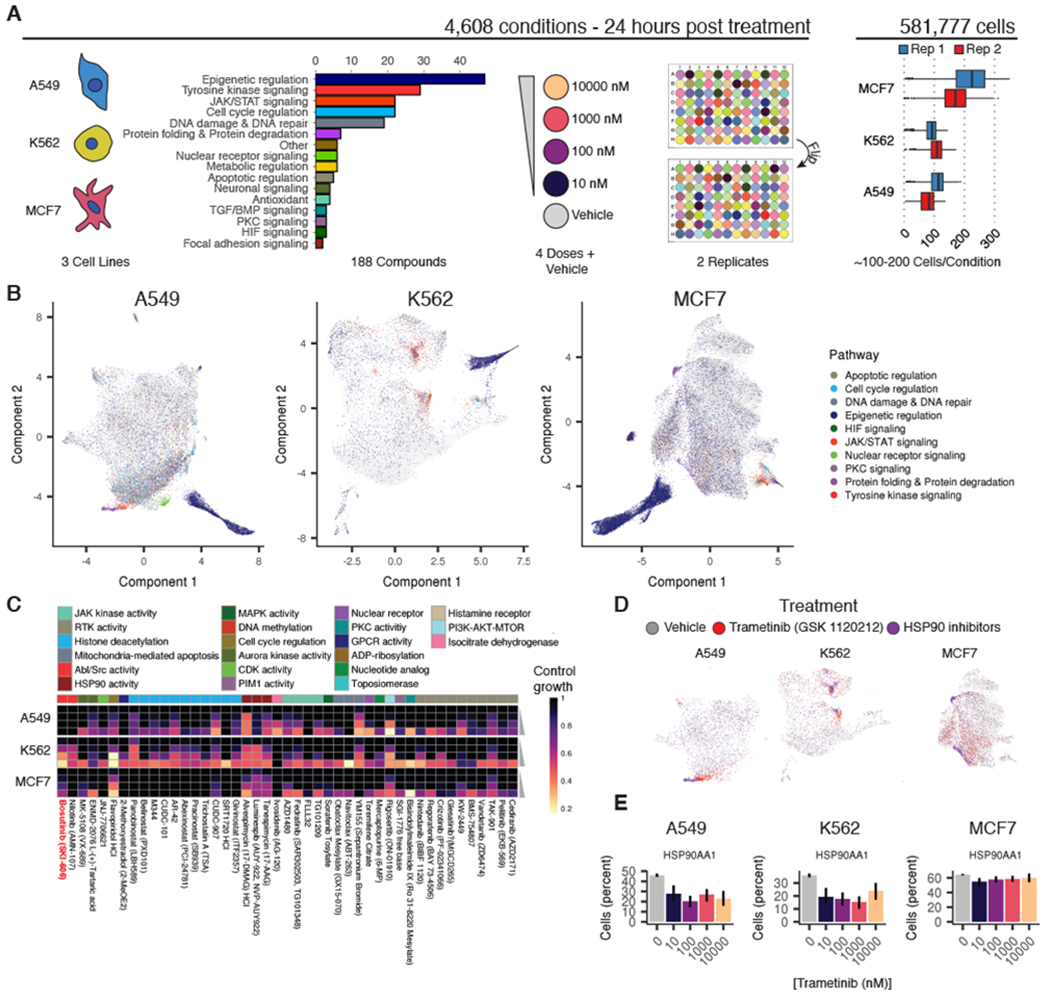
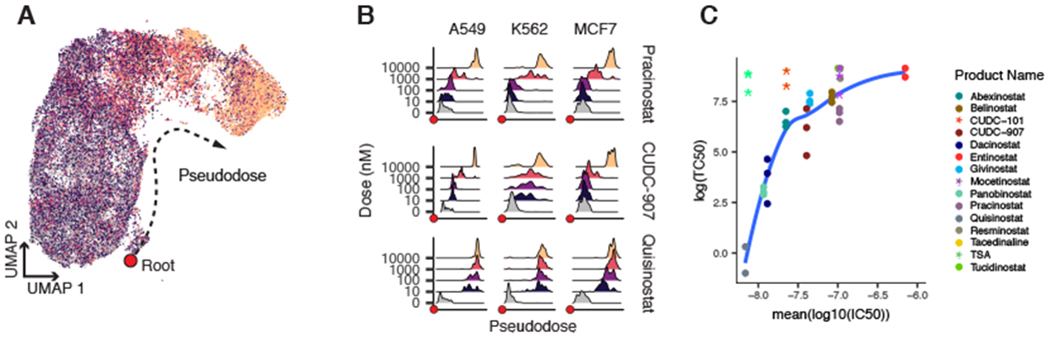
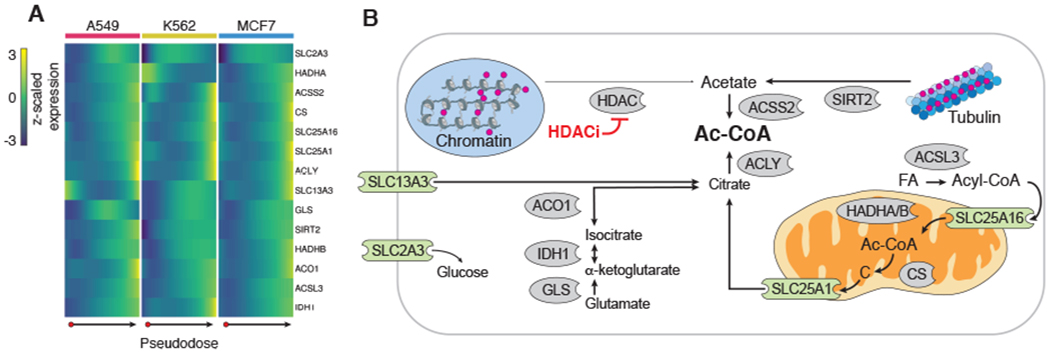
High-throughput chemical screens typically use coarse assays such as cell survival, limiting what can be learned about mechanisms of action, off-target effects, and heterogeneous responses. Here, we introduce "sci-Plex," which uses "nuclear hashing" to quantify global transcriptional responses to thousands of independent perturbations at single-cell resolution. As a proof of concept, we applied sci-Plex to screen three cancer cell lines exposed to 188 compounds. In total, we profiled ~650,000 single-cell transcriptomes across ~5000 independent samples in one experiment. Our results reveal substantial intercellular heterogeneity in response to specific compounds, commonalities in response to families of compounds, and insight into differential properties within families. In particular, our results with histone deacetylase inhibitors support the view that chromatin acts as an important reservoir of acetate in cancer cells.
Copyright © 2019 The Authors, some rights reserved; exclusive licensee American Association for the Advancement of Science. No claim to original U.S. Government Works.
Conflict of interest statement
Figures
Similar articles
-
Multiplexed single-cell RNA-seq via transient barcoding for simultaneous expression profiling of various drug perturbations.Sci Adv. 2019 May 15;5(5):eaav2249. doi: 10.1126/sciadv.aav2249. eCollection 2019 May. Sci Adv. 2019. PMID: 31106268 Free PMC article.
-
Targeted Perturb-seq enables genome-scale genetic screens in single cells.Nat Methods. 2020 Jun;17(6):629-635. doi: 10.1038/s41592-020-0837-5. Epub 2020 Jun 1. Nat Methods. 2020. PMID: 32483332 Free PMC article.
-
Integrating LINCS Data to Evaluate Cancer Transcriptome Modifying Potential of Small-molecule Compounds for Drug Repositioning.Comb Chem High Throughput Screen. 2021;24(9):1340-1350. doi: 10.2174/1386207323666201027120149. Comb Chem High Throughput Screen. 2021. PMID: 33109034
-
Applying high-dimensional single-cell technologies to the analysis of cancer immunotherapy.Nat Rev Clin Oncol. 2021 Apr;18(4):244-256. doi: 10.1038/s41571-020-00449-x. Epub 2020 Dec 4. Nat Rev Clin Oncol. 2021. PMID: 33277626 Free PMC article. Review.
-
High-throughput single-cell transcriptomics on organoids.Curr Opin Biotechnol. 2019 Feb;55:167-171. doi: 10.1016/j.copbio.2018.11.002. Epub 2018 Nov 29. Curr Opin Biotechnol. 2019. PMID: 30504008 Review.
Cited by
-
New horizons in the stormy sea of multimodal single-cell data integration.Mol Cell. 2022 Jan 20;82(2):248-259. doi: 10.1016/j.molcel.2021.12.012. Mol Cell. 2022. PMID: 35063095 Free PMC article. Review.
-
Learning single-cell perturbation responses using neural optimal transport.Nat Methods. 2023 Nov;20(11):1759-1768. doi: 10.1038/s41592-023-01969-x. Epub 2023 Sep 28. Nat Methods. 2023. PMID: 37770709 Free PMC article.
-
Mitochondrial Proteostasis Requires Genes Encoded in a Neurodevelopmental Syndrome Locus.J Neurosci. 2021 Aug 4;41(31):6596-6616. doi: 10.1523/JNEUROSCI.2197-20.2021. Epub 2021 Jul 14. J Neurosci. 2021. PMID: 34261699 Free PMC article.
-
Understanding glioblastoma at the single-cell level: Recent advances and future challenges.PLoS Biol. 2024 May 30;22(5):e3002640. doi: 10.1371/journal.pbio.3002640. eCollection 2024 May. PLoS Biol. 2024. PMID: 38814900 Free PMC article.
-
ALS is imprinted in the chromatin accessibility of blood cells.Cell Mol Life Sci. 2023 Apr 24;80(5):131. doi: 10.1007/s00018-023-04769-w. Cell Mol Life Sci. 2023. PMID: 37095391 Free PMC article.
References
Publication types
MeSH terms
Substances
Grants and funding
LinkOut - more resources
Full Text Sources
Other Literature Sources
Molecular Biology Databases
Research Materials
