

Hyperglycemia induces key genetic and phenotypic changes in human liver epithelial HepG2 cells which parallel the Leprdb/J mouse model of non-alcoholic fatty liver disease (NAFLD)
- PMID: 31805072
- PMCID: PMC6894821
- DOI: 10.1371/journal.pone.0225604
Hyperglycemia induces key genetic and phenotypic changes in human liver epithelial HepG2 cells which parallel the Leprdb/J mouse model of non-alcoholic fatty liver disease (NAFLD)
Abstract
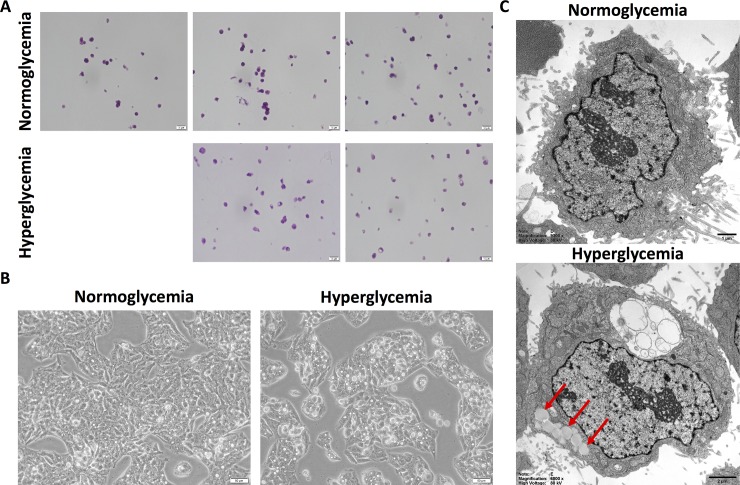
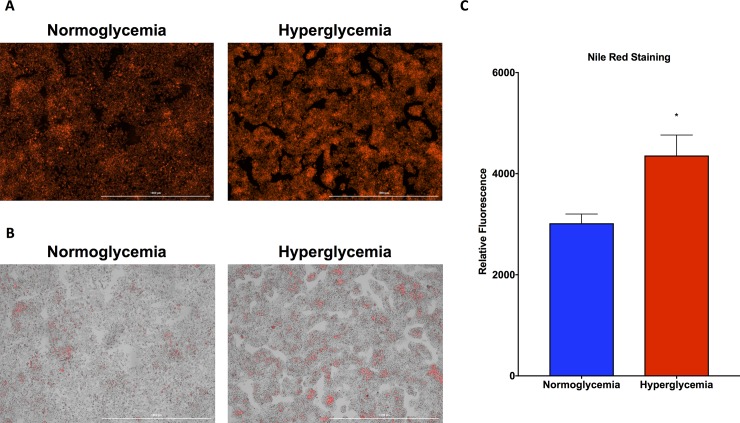
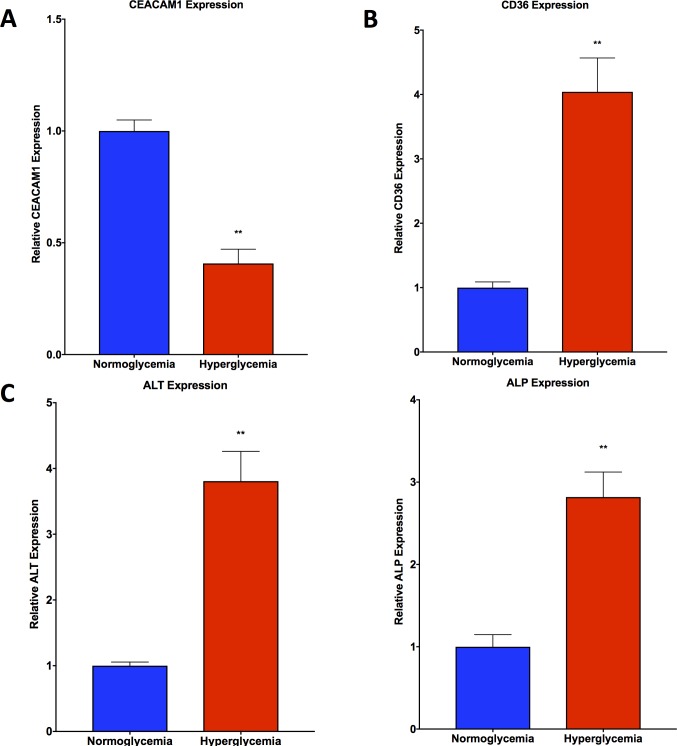
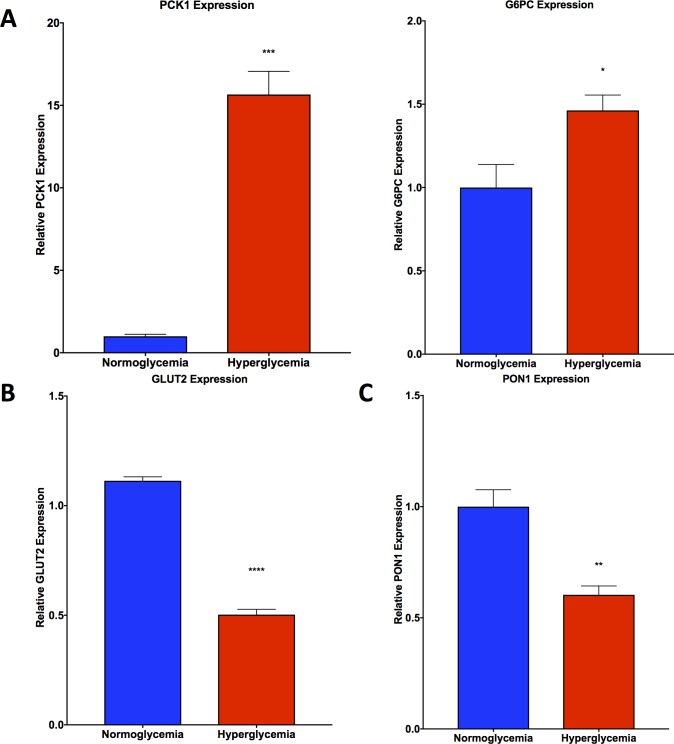
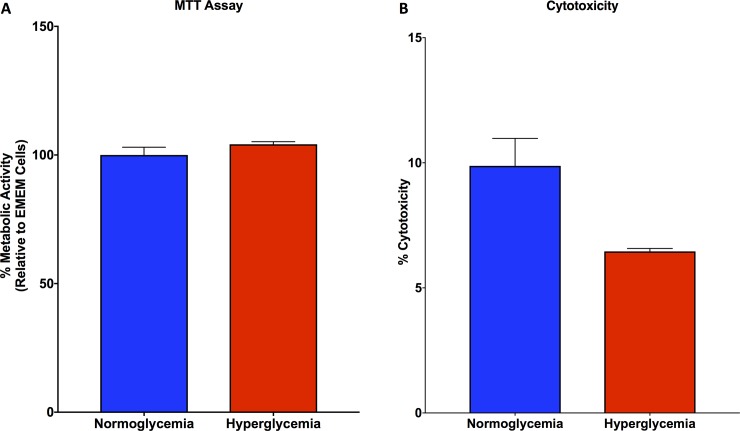
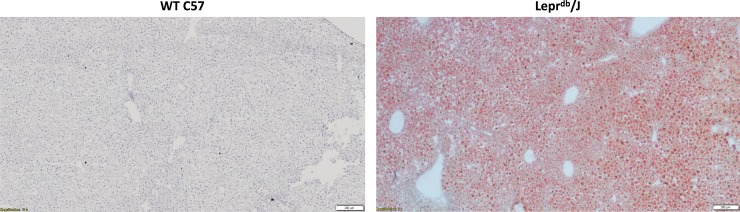
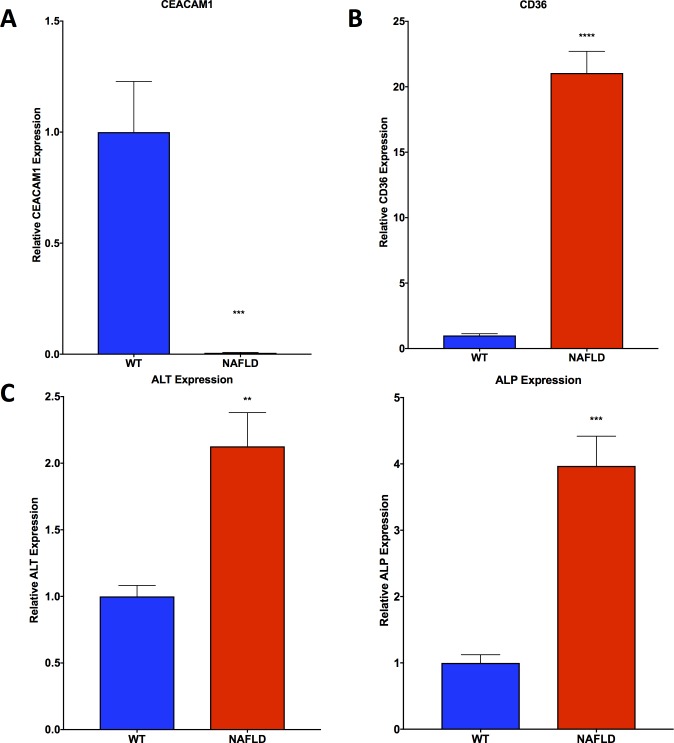
Non-alcoholic fatty liver disease (NAFLD) is a growing global health concern. With a propensity to progress towards non-alcoholic steatohepatitis (NASH), cirrhosis, and hepatocellular carcinoma, NAFLD is an important link amongst a multitude of comorbidities including obesity, diabetes, and cardiovascular and kidney disease. As several in vivo models of hyperglycemia and NAFLD are employed to investigate the pathophysiology of this disease process, we aimed to characterize an in vitro model of hyperglycemia that was amenable to address molecular mechanisms and therapeutic targets at the cellular level. Utilizing hyperglycemic cell culturing conditions, we induced steatosis within a human hepatocyte cell line (HepG2 cells), as confirmed by electron microscopy. The deposition and accumulation of lipids within hyperglycemic HepG2 cells is significantly greater than in normoglycemic cells, as visualized and quantified by Nile red staining. Alanine aminotransferase (ALT) and alkaline phosphatase (ALP), diagnostic biomarkers for liver damage and disease, were found to be upregulated in hyperglycemic HepG2 cells as compared with normoglycemic cells. Suppression of CEACAM1, GLUT2, and PON1, and elevation of CD36, PCK1, and G6PK were also found to be characteristic in hyperglycemic HepG2 cells compared with normoglycemic cells, suggesting insulin resistance and NAFLD. These in vitro findings mirror the characteristic genetic and phenotypic profile seen in Leprdb/J mice, a well-established in vivo model of NAFLD. In conclusion, we characterize an in vitro model displaying several key genetic and phenotypic characteristics in common with NAFLD that may assist future studies in addressing the molecular mechanisms and therapeutic targets to combat this disease.
Conflict of interest statement
The authors have declared that no competing interests exist.
Figures
Similar articles
-
The role of hepassocin in the development of non-alcoholic fatty liver disease.J Hepatol. 2013 Nov;59(5):1065-72. doi: 10.1016/j.jhep.2013.06.004. Epub 2013 Jun 18. J Hepatol. 2013. PMID: 23792031
-
Intracellular and extracellular miRNome deregulation in cellular models of NAFLD or NASH: Clinical implications.Nutr Metab Cardiovasc Dis. 2016 Dec;26(12):1129-1139. doi: 10.1016/j.numecd.2016.08.004. Epub 2016 Aug 20. Nutr Metab Cardiovasc Dis. 2016. PMID: 27756518
-
Lycopus lucidus Turcz. ex Benth. Attenuates free fatty acid-induced steatosis in HepG2 cells and non-alcoholic fatty liver disease in high-fat diet-induced obese mice.Phytomedicine. 2019 Mar 1;55:14-22. doi: 10.1016/j.phymed.2018.07.008. Epub 2018 Jul 18. Phytomedicine. 2019. PMID: 30668424
-
Non-Alcoholic Fatty Liver Disease.Adv Exp Med Biol. 2017;960:443-467. doi: 10.1007/978-3-319-48382-5_19. Adv Exp Med Biol. 2017. PMID: 28585211 Review.
-
Epigenetics in non-alcoholic fatty liver disease.Mol Aspects Med. 2017 Apr;54:78-88. doi: 10.1016/j.mam.2016.11.008. Epub 2016 Nov 23. Mol Aspects Med. 2017. PMID: 27889327 Review.
Cited by
-
CD40 Receptor Knockout Protects against Microcystin-LR (MC-LR) Prolongation and Exacerbation of Dextran Sulfate Sodium (DSS)-Induced Colitis.Biomedicines. 2020 Jun 2;8(6):149. doi: 10.3390/biomedicines8060149. Biomedicines. 2020. PMID: 32498446 Free PMC article.
-
Six Decades of History of Hypertension Research at the University of Toledo: Highlighting Pioneering Contributions in Biochemistry, Genetics, and Host-Microbiota Interactions.Curr Hypertens Rep. 2022 Dec;24(12):669-685. doi: 10.1007/s11906-022-01226-0. Epub 2022 Oct 27. Curr Hypertens Rep. 2022. PMID: 36301488 Free PMC article. Review.
-
When Sugar Reaches the Liver: Phenotypes of Patients with Diabetes and NAFLD.J Clin Med. 2022 Jun 8;11(12):3286. doi: 10.3390/jcm11123286. J Clin Med. 2022. PMID: 35743358 Free PMC article. Review.
-
Complex Positive Effects of SGLT-2 Inhibitor Empagliflozin in the Liver, Kidney and Adipose Tissue of Hereditary Hypertriglyceridemic Rats: Possible Contribution of Attenuation of Cell Senescence and Oxidative Stress.Int J Mol Sci. 2021 Sep 30;22(19):10606. doi: 10.3390/ijms221910606. Int J Mol Sci. 2021. PMID: 34638943 Free PMC article.
-
Association between serum vitamin D concentration and liver fibrosis in diabetes mellitus patients: a cross-sectional study from the NHANES database.Acta Diabetol. 2024 Nov;61(11):1393-1402. doi: 10.1007/s00592-024-02292-3. Epub 2024 Jun 3. Acta Diabetol. 2024. PMID: 38831202
References
-
- Grasselli E, Canesi L, Portincasa P, Voci A, Vergani L, Demori I. Models of non-Alcoholic Fatty Liver Disease and Potential Translational Value: the Effects of 3,5-L-diiodothyronine. Ann Hepatol. 2017;16(5):707–19. - PubMed
Publication types
MeSH terms
Substances
Grants and funding
LinkOut - more resources
Full Text Sources
Medical
Research Materials
Miscellaneous
