. 2020 Feb 14;94(5):e01543-19.
doi: 10.1128/JVI.01543-19. Print 2020 Feb 14.

Impact of Suboptimal APOBEC3G Neutralization on the Emergence of HIV Drug Resistance in Humanized Mice

Affiliations

Impact of Suboptimal APOBEC3G Neutralization on the Emergence of HIV Drug Resistance in Humanized Mice

Matthew M Hernandez et al. J Virol. .

Abstract

HIV diversification facilitates immune escape and complicates antiretroviral therapy. In this study, we take advantage of a humanized-mouse model to probe the contribution of APOBEC3 mutagenesis to viral evolution. Humanized mice were infected with isogenic HIV molecular clones (HIV-WT, HIV-45G, and HIV-ΔSLQ) that differ in their abilities to counteract APOBEC3G (A3G). Infected mice remained naive or were treated with the reverse transcriptase (RT) inhibitor lamivudine (3TC). Viremia, emergence of drug-resistant variants, and quasispecies diversification in the plasma compartment were determined throughout infection. While both HIV-WT and HIV-45G achieved robust infection, over time, HIV-45G replication was significantly reduced compared to that of HIV-WT in the absence of 3TC treatment. In contrast, treatment responses differed significantly between HIV-45G- and HIV-WT-infected mice. Antiretroviral treatment failed in 91% of HIV-45G-infected mice, while only 36% of HIV-WT-infected mice displayed a similar negative outcome. Emergence of 3TC-resistant variants and nucleotide diversity were determined by analyzing 155,462 single HIV reverse transcriptase gene (RT) and 6,985 vif sequences from 33 mice. Prior to treatment, variants with genotypic 3TC resistance (RT-M184I/V) were detected at low levels in over a third of all the animals. Upon treatment, the composition of the plasma quasispecies rapidly changed, leading to a majority of circulating viral variants encoding RT-184I. Interestingly, increased viral diversity prior to treatment initiation correlated with higher plasma viremia in HIV-45G-infected animals, but not in HIV-WT-infected animals. Taken together, HIV variants with suboptimal anti-A3G activity were attenuated in the absence of selection but displayed a fitness advantage in the presence of antiretroviral treatment.IMPORTANCE Both viral (e.g., RT) and host (e.g., A3G) factors can contribute to HIV sequence diversity. This study shows that suboptimal anti-A3G activity shapes viral fitness and drives viral evolution in the plasma compartment in humanized mice.

Keywords: APOBEC3; HIV Vif; HIV diversification; HIV drug resistance; human immunodeficiency virus; humanized mice; virus-host interactions.


Figures

FIG 1
FIG 1
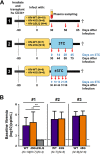
Infection of humanized mice with HIV-Vif variants. (A) Newborn NSG mice were irradiated after birth, and human donor cord blood-derived CD34+ cells were transplanted into them. The mice were infected intraperitoneally with 2 × 105 TCID50 of virus (HIV-WT, HIV-45G, or HIV-ΔSLQ). The specifics for each of the three infection experiments are provided in the timelines. Plasma was collected at the indicated time points for viremia measurements and sequence analysis. (B) Comparison of plasma viremias at day 30 postinfection (baseline) in mice infected with different viruses in three different experiments (#1, #2, and #3). The lower limit of detection of the assay was 400 copies (cp)/ml. The means and standard deviations of the viral loads are depicted. Viremia for HIV-ΔSLQ was significantly different from HIV-WT or HIV-45G viremia (P ≤ 0.0020; Mann-Whitney test). **, P ≤ 0.01.
FIG 2
FIG 2
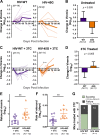
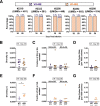
Viral replication in humanized mice in the absence or presence of 3TC treatment. (A) Spaghetti plots depicting the changes in viremia relative to baseline viral load (day 30 postinfection) of individual untreated mice (thin lines) and mean changes in viremia in untreated mice (thick lines). (B) Changes in viremia at the end of infection (last available time point) versus baseline viremia in untreated mice. Means and standard deviation are depicted. P = 0.0026 by unpaired Student's t test. (C) Spaghetti plots depicting the changes in viremia in 3TC-treated mice. (D) Overall change in viremia at the end of infection in 3TC-treated mice, with means and standard deviations. P = 0.0045 by unpaired Student's t test. (E) Rebound viremia {defined as the maximum fold rebound in viral load (VL) from nadir [maximum level of suppression observed; log(VLmax/VLnadir)]} for mice treated with 3TC. Each point represents an individual mouse. Means and standard deviations are depicted. P = 0.0068 by Mann-Whitney test. **, P ≤ 0.01. (F) The rate of rebound was also measured over the time from nadir to maximum viremia. Means and standard deviations are shown. P = 0.0052 by unpaired Student's t test. (G) Qualitative assessment of treatment outcomes. 3TC treatment was defined as successful if the viral rebound was less than 0.5 log10 units from the nadir. Conversely, treatment failure was met if the viral rebound was greater than 0.5 log10 units from the nadir. P = 0.0237; Fisher’s exact test.
FIG 3
FIG 3
Drug resistance development in 3TC-treated mice. (A) Genotypic 3TC drug resistance is due to single point mutations in codon 184 of the HIV reverse transcriptase (RT) gene. Methionine (M184) represents the susceptible wild-type sequence, while RT-184I or RT-184V renders the virus resistant to 3TC. (B) Preexisting 3TC resistance detected at day 30 postinfection (D30) prior to 3TC treatment initiation. Each dot represents the percentage of viruses encoding RT-184I or RT-184V in a given mouse. Minority 3TC-resistant viral populations were defined as representing at least 1% of the total number of UMIDs sequenced for each mouse at this time point (dotted line). Some mice harbored both M184I/V variants and are indicated by mouse ID number. *, P ≤ 0.05; Wilcoxon matched-pairs signed-rank test. (C) Spaghetti plots longitudinally depicting the relative proportion of 3TC-susceptible and -resistant viral variants in HIV-WT-infected mice. M184, RT-184I, and RT-184V data for individual mice (thin lines) and mean proportions at each time point (thick lines) are depicted. The slopes of lines of best fit were calculated to measure the kinetics of RT-184M, RT-184I, and RT-184V variants. The slopes were compared by F test (ns, not significant; P = 0.5372). (D) Spaghetti plots longitudinally depicting the relative proportions of 3TC-susceptible and -resistant viral variants in HIV-45G-infected mice. The slopes were compared by F test (P = 0.0035).
FIG 4
FIG 4
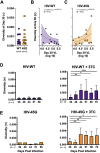
Genetic diversity of circulating viruses in the plasma of infected mice. (A) Dot plot depicting nucleotide diversity (π) in the sequenced HIV RT gene in HIV-WT- and HIV-45G-infected mice prior to initiation of 3TC treatment (30 days postinfection). The points represent π in each mouse, and the horizontal lines depict means. (B) Diversity and viremia (VL) data in mice infected with HIV-WT prior to treatment were fitted to a weighted nonlinear exponential-growth (Malthusian) model. Best-fit curve and 95% CI bands are shown. The corresponding curve equation and weighted correlation coefficient (R) are depicted at the top. (C) Diversity and VL data for mice infected with HIV-45G prior to treatment fitted to an exponential-growth model as in panel B. (D) Diversity in plasma viruses of HIV-WT-infected mice over time (left, untreated; right, 3TC treated). Significance was determined by Mann-Whitney test (*, P ≤ 0.05; **, P ≤ 0.01; ****, P ≤ 0.0001). (E) Diversity in plasma viruses of HIV-45G-infected mice over time (left untreated; right, 3TC treated). Significance was determined by Mann-Whitney test (*, P ≤ 0.05; **, P ≤ 0.01).
FIG 5
FIG 5
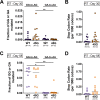
Mutagenesis in the HIV RT gene in plasma viruses of HIV-infected mice. (A) Dot plots depicting fractions of GG and GA dinucleotides mutated to AG (GG-to-AG) and AA (GA-to-AA), respectively, in individual mice (data points) prior to 3TC treatment (day 30 postinfection). The horizontal lines depict means. P = 0.0020; Wilcoxon matched-pairs signed-rank test. (B) Stop codons were quantitated across all plasma sequences, and a stop codon rate for every 1,000 codons sequenced was calculated for infected mice at day 30 postinfection. (C) Fraction of GG-to-AG or GA-to-AA dinucleotide mutations in plasma samples at day 58 postinfection in 3TC-treated mice. *, P ≤ 0.05; **, P ≤ 0.01; Wilcoxon matched-pairs signed-rank test. (D) Stop codon rates in plasma samples from day 58 postinfection.
FIG 6
FIG 6
Characterizing HIV vif mutations in infected mice. (A) Genotypes of vif codon 45 in five mice infected with HIV-45G and treated with 3TC from 30 to 58 days postinfection. The percentages of 45G and revertant E45 sequences are indicated on stacked bar plots. The percentages of the latter are annotated, as well. (B) Dot plots depicting nucleotide diversity (π) in vif sequences in individual mice (data points) infected with HIV-WT or HIV-45G at 30 days postinfection (prior to 3TC treatment). The horizontal lines depict means. (C) Dot plots depicting fractions of GG and GA dinucleotides mutated to AG (GG-to-AG) and AA (GA-to-AA), respectively, in individual mice (data points) at 30 days postinfection. The horizontal lines depict means. (D) Stop codon rates were quantitated across plasma vif sequences at day 30 postinfection (as in Fig. 5B). (E) Dot plots depicting π in vif sequences in individual mice (data points) at day 58 postinfection in 3TC-treated mice. P = 0.0357; Mann-Whitney test. *, P ≤ 0.05. (F) Fractions of GG-to-AG or GA-to-AA dinucleotide mutations in vif at day 58 postinfection in 3TC-treated mice. (G) Stop codon rates in vif sequences determined at day 58 postinfection in 3TC-treated mice.

Similar articles

Cited by

References

    1. Wood N, Bhattacharya T, Keele BF, Giorgi E, Liu M, Gaschen B, Daniels M, Ferrari G, Haynes BF, McMichael A, Shaw GM, Hahn BH, Korber B, Seoighe C. 2009. HIV evolution in early infection: selection pressures, patterns of insertion and deletion, and the impact of APOBEC. PLoS Pathog 5:e1000414. doi:10.1371/journal.ppat.1000414. - DOI - PMC - PubMed
    1. Rhodes TD, Nikolaitchik O, Chen J, Powell D, Hu WS. 2005. Genetic recombination of human immunodeficiency virus type 1 in one round of viral replication: effects of genetic distance, target cells, accessory genes, and lack of high negative interference in crossover events. J Virol 79:1666–1677. doi:10.1128/JVI.79.3.1666-1677.2005. - DOI - PMC - PubMed
    1. Smyth RP, Negroni M. 2016. A step forward understanding HIV-1 diversity. Retrovirology 13:27. doi:10.1186/s12977-016-0259-8. - DOI - PMC - PubMed
    1. Ji JP, Loeb LA. 1992. Fidelity of HIV-1 reverse transcriptase copying RNA in vitro. Biochemistry 31:954–958. doi:10.1021/bi00119a002. - DOI - PubMed
    1. Hu WS, Hughes SH. 2012. HIV-1 reverse transcription. Cold Spring Harb Perspect Med 2:a006882. doi:10.1101/cshperspect.a006882. - DOI - PMC - PubMed

Publication types

LinkOut - more resources