

Influenza B Viruses Exhibit Lower Within-Host Diversity than Influenza A Viruses in Human Hosts
- PMID: 31801858
- PMCID: PMC7022338
- DOI: 10.1128/JVI.01710-19
Influenza B Viruses Exhibit Lower Within-Host Diversity than Influenza A Viruses in Human Hosts
Abstract
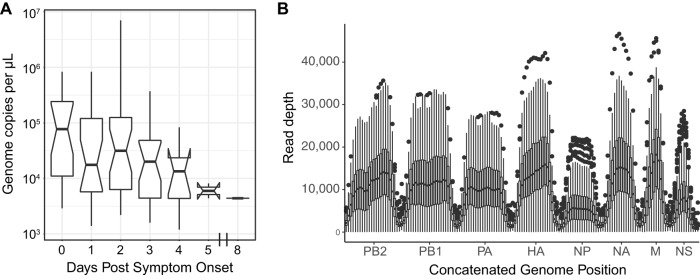
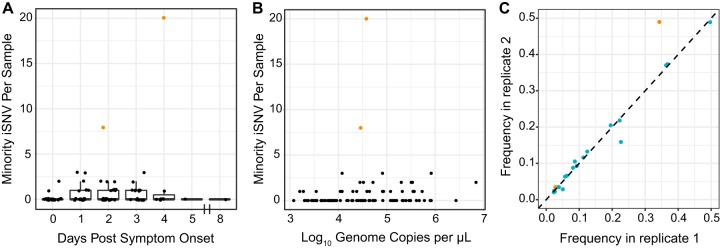
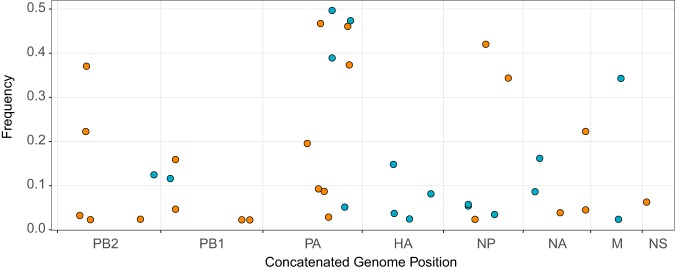
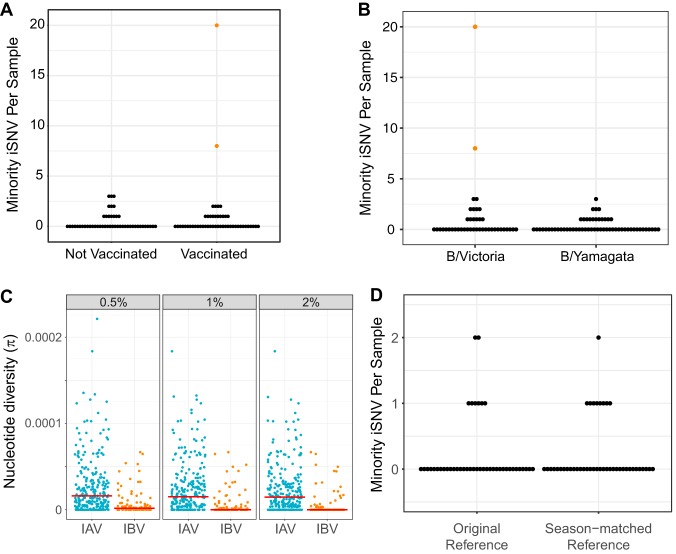
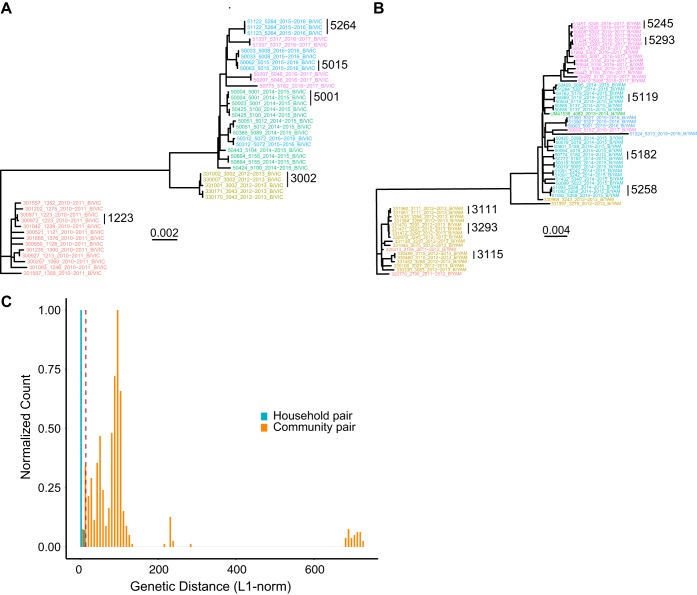
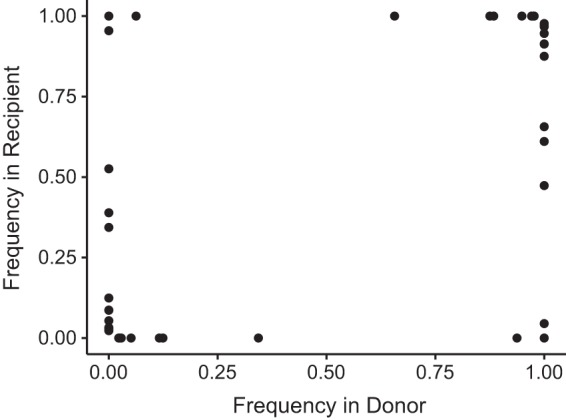
Influenza B virus (IBV) undergoes seasonal antigenic drift more slowly than influenza A virus, but the reasons for this difference are unclear. While the evolutionary dynamics of influenza viruses play out globally, they are fundamentally driven by mutation, reassortment, drift, and selection at the level of individual hosts. These processes have recently been described for influenza A virus, but little is known about the evolutionary dynamics of IBV during individual infections and transmission events. Here, we define the within-host evolutionary dynamics of IBV by sequencing virus populations from naturally infected individuals enrolled in a prospective, community-based cohort over 8,176 person-seasons of observation. Through analysis of high depth-of-coverage sequencing data from samples from 91 individuals with influenza B, we find that IBV accumulates lower genetic diversity than previously observed for influenza A virus during acute infections. Consistent with studies of influenza A viruses, the within-host evolution of IBVs is characterized by purifying selection and the general absence of widespread positive selection of within-host variants. Analysis of shared genetic diversity across 15 sequence-validated transmission pairs suggests that IBV experiences a tight transmission bottleneck similar to that of influenza A virus. These patterns of local-scale evolution are consistent with the lower global evolutionary rate of IBV.IMPORTANCE The evolution of influenza virus is a significant public health problem and necessitates the annual evaluation of influenza vaccine formulation to keep pace with viral escape from herd immunity. Influenza B virus is a serious health concern for children, in particular, yet remains understudied compared to influenza A virus. Influenza B virus evolves more slowly than influenza A virus, but the factors underlying this are not completely understood. We studied how the within-host diversity of influenza B virus relates to its global evolution by sequencing viruses from a community-based cohort. We found that influenza B virus populations have lower within-host genetic diversity than influenza A virus and experience a tight genetic bottleneck during transmission. Our work provides insights into the varying dynamics of influenza viruses in human infection.
Keywords: bottleneck; diversity; evolution; influenza B virus; influenza virus; transmission.
Copyright © 2020 American Society for Microbiology.
Figures
Similar articles
-
Cell-Adapted Mutations and Antigenic Diversity of Influenza B Viruses in Missouri, 2019-2020 Season.Viruses. 2021 Sep 22;13(10):1896. doi: 10.3390/v13101896. Viruses. 2021. PMID: 34696325 Free PMC article.
-
Within-Host Evolution of Human Influenza Virus.Trends Microbiol. 2018 Sep;26(9):781-793. doi: 10.1016/j.tim.2018.02.007. Epub 2018 Mar 10. Trends Microbiol. 2018. PMID: 29534854 Free PMC article. Review.
-
Stochastic processes constrain the within and between host evolution of influenza virus.Elife. 2018 May 3;7:e35962. doi: 10.7554/eLife.35962. Elife. 2018. PMID: 29683424 Free PMC article.
-
The evolutionary dynamics of human influenza B virus.J Mol Evol. 2008 Jun;66(6):655-63. doi: 10.1007/s00239-008-9119-z. Epub 2008 May 27. J Mol Evol. 2008. PMID: 18504518 Free PMC article.
-
Constraints, Drivers, and Implications of Influenza A Virus Reassortment.Annu Rev Virol. 2017 Sep 29;4(1):105-121. doi: 10.1146/annurev-virology-101416-041726. Epub 2017 May 26. Annu Rev Virol. 2017. PMID: 28548881 Review.
Cited by
-
Genetic drift and purifying selection shape within-host influenza A virus populations during natural swine infections.bioRxiv [Preprint]. 2023 Oct 25:2023.10.23.563581. doi: 10.1101/2023.10.23.563581. bioRxiv. 2023. Update in: PLoS Pathog. 2024 Apr 16;20(4):e1012131. doi: 10.1371/journal.ppat.1012131 PMID: 37961583 Free PMC article. Updated. Preprint.
-
Use of hemagglutinin and neuraminidase amplicon-based high-throughput sequencing with variant analysis to detect co-infection and resolve identical consensus sequences of seasonal influenza in a university setting.BMC Infect Dis. 2021 Aug 13;21(1):810. doi: 10.1186/s12879-021-06526-5. BMC Infect Dis. 2021. PMID: 34388979 Free PMC article.
-
Distinct patterns of within-host virus populations between two subgroups of human respiratory syncytial virus.Nat Commun. 2021 Aug 26;12(1):5125. doi: 10.1038/s41467-021-25265-4. Nat Commun. 2021. PMID: 34446722 Free PMC article. Clinical Trial.
-
Safety, Immunogenicity, and Protective Efficacy of a Chimeric A/B Live Attenuated Influenza Vaccine in a Mouse Model.Microorganisms. 2021 Jan 27;9(2):259. doi: 10.3390/microorganisms9020259. Microorganisms. 2021. PMID: 33513862 Free PMC article.
-
A large effective population size for established within-host influenza virus infection.Elife. 2020 Aug 10;9:e56915. doi: 10.7554/eLife.56915. Elife. 2020. PMID: 32773034 Free PMC article.
References
Publication types
MeSH terms
Substances
Grants and funding
LinkOut - more resources
Full Text Sources
Medical
