. 2019 Nov 13:10:2638.
doi: 10.3389/fimmu.2019.02638. eCollection 2019.

Activation of the IL-4/STAT6 Signaling Pathway Promotes Lung Cancer Progression by Increasing M2 Myeloid Cells

Affiliations

Activation of the IL-4/STAT6 Signaling Pathway Promotes Lung Cancer Progression by Increasing M2 Myeloid Cells

Cuiping Fu et al. Front Immunol. .

Abstract

Emerging evidence shows that signal transducer and activator of transcription 6 (STAT6) plays critical roles in tumor development. We previously found high-level expression of STAT6 in human lung adenocarcinoma and squamous cell carcinoma, specifically in infiltrated immune cells located in the lung interstitium. Nevertheless, the role of STAT6 signaling in lung carcinogenesis and lung cancer proliferation and its underlying mechanisms remain unclear. This study aimed to investigate the role of STAT6 and the interaction between STAT6 and the tumor microenvironment in pulmonary tumorigenesis. We established a murine model of primary lung carcinogenesis in STAT6-deficient (STAT6-/-) and STAT6 wild-type (WT) BALB/c mice using the carcinogen urethane. Two-month-old male mice were intraperitoneally injected with urethane (1 g/kg) dissolved in phosphate buffered saline (PBS). Primary tumors were monitored in vivo by positron emission tomography scanning. At 4, 6, and 9 months after urethane injection, lung tumors were harvested from the STAT6-/- and WT mice for analysis. Small interfering RNA was used to downregulate the expression of STAT6 in tumor cells. Fluorescence activated cell sorting analysis was used to analyze fluorescence-conjugated cell markers. Transwell assays were used in coculturing experiments. STAT6 protein expression was detected by Western blotting, immunohistochemistry, and immunofluorescence. STAT6 mRNA expression was detected by quantitative real time-polymerase chain reaction. Cell Counting Kit-8 and colony formation assays were performed to evaluate cell proliferation. We detected high expression of STAT6 in CD11b+ cells of lung carcinoma. Our results indicate that STAT6 deficiency inhibits carcinogen-induced tumor growth and improves prognosis. STAT6 deficiency also decreased the mobilization and differentiation of CD11b+ cells. STAT6 deficiency in CD11b+ cells but not tumor cells decreased interleukin (IL)-4 secretion and the differentiation of CD11b+ cells into M2 macrophage cells. In conclusion, our findings indicate that IL-4/STAT6 signaling in CD11b+ cells promotes lung cancer progression by triggering an IL-4 positive feedback loop and increasing M2 myeloid cells. STAT6 may be a new therapeutic target for the prevention and treatment of lung cancer.

Keywords: CD11b; IL-4; STAT6; lung cancer; macrophage polarization.


Figures

Figure 1
Figure 1
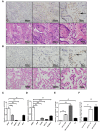
Expression of signal transducer and activator of transcription 6 (STAT6) in lung cancer cells. (A) Immunohistochemical (IHC) staining of STAT6 in lung squamous carcinoma and corresponding hematoxylin and eosin (H&E)-stained images. (B) IHC staining of STAT6 in lung adenoma carcinoma and corresponding H&E-stained images. (C) Comparison of STAT6 mRNA expression between peripheral blood mononuclear cells (PBMCs) and human-derived lung cells. Human-derived lung cell lines bought from ATCC, including normal human bronchial epithelial (HBE), human pulmonary microvascular endothelial cell (HPMEC), human embryonic lung fibroblast (HELF), and human bronchial cell line BEAS2. (D) Comparison of STAT6 mRNA expression between PBMC cells and lung cancer-derived cell lines. (E) Comparison of STAT6 mRNA expression between immune cells and tumor cells. Spleen cells (SC) were obtained from 6-week old BALB/c mice and removed red blood cells. CD11b+ cells and macrophage cells were obtained from bone marrow-derived cells of the same mice after removing red blood cells. (F) Comparison of STAT6 mRNA expression between cells. Tumor cells separated from primary tumor tissue induced by urethane, and CD11b+ cells and macrophages from the bone marrow of WT mice after urethane inoculation (at time point of 6 months). Data are presented as mean ± SD of one representative experiment. Similar results were seen in three independent experiments. **P < 0.01, ***P < 0.001.
Figure 2
Figure 2
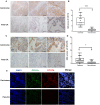
Expression of signal transducer and activator of transcription 6 (STAT6) in CD11b+ cells in interstitial cells of carcinoma tissue. (A) Immunohistochemical (IHC) staining of CD11b in para-carcinoma and carcinoma tissues of lung cancer patients. Bars represent 2 mm, 500 μm, and 200 μm, respectively. The same magnification is shown in the same column of images. Representative figure of pulmonary adenocarcinoma in the lung cancer patients was shown in Supplementary Figure 5. (B) IHC score of CD11b in tissue microarrays of carcinoma and para-carcinoma in patients with lung cancer. (C) IHC staining of STAT6 in para-carcinoma and carcinoma tissues of lung cancer patients. Bars represent 2 mm, 500 μm, and 200 μm, respectively. The same magnification is shown in the same column of images. (D) IHC score of STAT6 in tissue microarrays of carcinoma and para-carcinoma in 36 patients with lung cancer. (E) Confocal scanning of STAT6 and CD11b expression in human lung tissue. Unpaired Student's t-tests were used unless noted otherwise. **P < 0.01, ***P < 0.001.
Figure 3
Figure 3
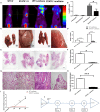
Effect of signal transducer and activator of transcription 6 (STAT6) deficiency on primary tumor growth. (A–H) Show results at 6 months after urethane inoculation. (A,B) Representative images and quantitative analysis of lung nodules of STAT6−/− mice or WT littermates detected by PET/MR at the time point of 4 months after inoculation of urethane. Urethane was intraperitoneally injected at 1 g/kg. (C) Facade of the lung from two groups; the two images on the left show WT tumor-bearing mice and the images on the right show STAT6−/− tumor-bearing mice. (D) Number of small (<300 μm) and large nodules (more than 300 μm). (E) Hematoxylin and eosin (H&E) staining of overall lung sections. The bar represents 5 mm. The four images have the same magnification. From left to right: WT+V, STAT6−/−+V, WT+urethane, STAT6−/−+urethane. (F) Quantification of lung nodules. (G) H&E-stained lung sections. The bar represents 2 mm. The four images have the same magnification. From left to right: WT+V, STAT6−/− +V, WT+urethane, STAT6−/−+urethane. (H) Quantification of mean length in the lung section. (I) Size of tumor nodules at 4, 6, and 9 months. WT+V: WT mice with PBS (vehicle) inoculation; STAT6−/−+V: STAT6 knockout mice with PBS (vehicle) inoculation. WT+urethane: WT mice with urethane inoculation; STAT6−/−+urethane: STAT6 knockout mice with urethane inoculation. (J) The timeline of this experiment. Briefly, 2-month-old mice were induced with primary carcinogen by urethane (1 g/kg), then were harvested for biochemistry analysis 6 months later of urethane, and part of mice were kept to 9 months for survival analysis. All mice were harvested at 9 months later of urethane. Data are presented as mean ± SD of one representative experiment. Similar results were obtained in three independent experiments. Unpaired Student's t-tests were used unless noted otherwise. *P < 0.05, ***P < 0.001.
Figure 4
Figure 4
CD11b+ cell staining and analysis in tumor-bearing mice. (A–D) Quantification of the percentages of CD11b+ cells in the blood, lung, bone marrow, and spleen in WT+vehicle, signal transducer and activator of transcription 6 (STAT6) −/−+vehicle, WT+urethane, and STAT6−/−+urethane groups. (E) Representative flow cytometry analysis results of CD11b+ cells in the lung of STAT6−/− and WT mice 6 months after vehicle or urethane inoculation. (F) Immunohistochemical (IHC) staining of CD11b+ in the lung. The upper and lower bars represent 500 and 200 μm, respectively. Images in the same row are of the same magnification. (G) Flow cytometry analysis diagram of CD3-CD4 in mice. (H) Percentage of CD3+CD8+ cells by flow cytometry analysis. (I,J) Expression of cytokines associated with cytotoxic T lymphocytes such as interferon (IFN)-γ and granzyme-b (pg/ml). Data are presented as mean ± SD of one representative experiment. Total number of gated cells was 5 × 10E4. Similar results were obtained in three independent experiments. Unpaired Student's t-tests were used unless noted otherwise. *P < 0.05, **P < 0.01, ***P < 0.001.
Figure 5
Figure 5
Depletion of signal transducer and activator of transcription 6 (STAT6) in CD11b+ cell affects tumor growth. (A,B) Lung cancer cells (LLC1) were cocultured with either bone marrow cells or spleen cells, and the percentages of CD11b+ cells were analyzed by FACS. (A) Percentage of CD11b+ cells in bone marrow cells derived from STAT6−/− mice or WT littermates when cocultured with LLC1 cells. (B) Percentage of CD11b+ cells in spleen cells derived from STAT6−/− mice or WT littermates when cocultured with LLC1 cells. (C,D) Proliferation curve of LLC1/A549 cells when cocultured with CD11b+ cells derived from mice. WT group indicates coculture of cancer cells with CD11b+ cells derived from WT mice; STAT6−/− group indicates coculture of cancer cells with the same number of CD11b+ cells derived from STAT6−/− mice as in the WT group; equal numbers of cancer cells were substituted for CD11b+ cells in the control group. (E) Facade of tumor volume in the control, WT, and STAT6−/− groups. An equal number of CD11b+ cells (1 × 10⁶) derived either from STAT6−/− mice or WT mice was mixed with 1 × 10⁶ LLC1 cells and inoculated subcutaneously into nude mice. An equal number of LLC1 cells (1 × 10⁶) was substituted for the CD11b+ cells in the control group. After 10 weeks, tumor sizes and weights were measured. (F) Tumor weights in the control, WT, and STAT6−/− groups. (G,H) Colony formation of cancer cells (CMT167) cocultured with CD11b+ cells derived from either STAT6−/− mice or WT littermates 7 days after the start of the experiment. The control group shows the colony formation of cancer cells cocultured with the same number of cancer cells as CD11b+ cells. *P < 0.05, **P < 0.01, ***P < 0.001.
Figure 6
Figure 6
M1 and M2 mobilization in the lung of signal transducer and activator of transcription 6 (STAT6)-deficient mice. (A,B) Fluorescent images of CD68 (green) and CD163 (red) in lung carcinoma and para-carcinoma tissues of WT and STAT6−/− tumor-bearing mice. (C) Flow cytometry analysis of M1 and M2 cells. (D–G). M1 and M2 cells in WT and STAT6−/− tumor-bearing mice. (D) Percentage of M1 cells (CD11b+ F4/80low Ly6ChighCD206) in the blood. (E) Percentage of M2 cells in the blood (CD11b+ F4/80highLy6CCD206+). (F) Percentage of M1 cells in the lung. (G) Percentage of M2 cells in the lung. (H) Relative mRNA expression of iNOS in CD11b+cells isolated from the lung. (I) Relative mRNA expression of Arg1 in CD11b+ cells directly obtained from mice. Total number of gated cells was 10 × 10E4. *P < 0.05, **P < 0.01, ***P < 0.001.
Figure 7
Figure 7
Effect of signal transducer and activator of transcription 6 (STAT6) on IL-4 secretion in vitro. (A) Concentration of IL-4 (pg/ml) from bronchoalveolar lavage fluid in tumor-bearing wild-type (WT) and STAT6−/− mice. (B) Concentration of IL-4 (pg/ml) in the serum when CD11b+ cells were cocultured with lung cancer cells (LLC1) using Transwell plates. CD11b+ cells were obtained for bone marrow of mice. (C) Secretion of IL-4 was measured by ELISA in the cocutured medium of tumor cells [STAT6+/+ or STAT6−/− with CD11b+ cells (STAT6+/+ or STAT6−/−)]. CON-Tumor: LLC1 tumor cells. Si-Tumor: STAT6 knockdown in LLC1 cells. CON-CD11b: CD11b+ cells. Si-CD11b: CD11b+ cells from STAT6−/− mice. CON-CD11bWTco: cocultured medium of LLC1 cells with STAT6+/+CD11b+ cells for analysis of IL-4 expression. CON-CD11bSTAT6co: cocultured medium of LLC1 cells with STAT6−/−CD11b+ cells for analysis of IL-4 expression. Si-CD11bWTco: cocultured medium of STAT6−/−LLC1 cells with STAT6+/+CD11b+ cells for analysis of IL-4 expression. Si-CD11bSTAT6co: cocultured medium of STAT6−/−LLC1 cells with STAT6−/−CD11b+ cells for analysis of IL-4 expression. (D) mRNA expression of IL-4 was analyzed using RT-PCR. CD11b+ cells were isolated from STAT6−/− mice and WT littermates. CON-CD11b: CD11b+ cells from bone marrow of WT mice. Si-CD11b: CD11b+ cells from STAT6−/− mice. CON-Tumor: LLC1 tumor cells. Si-Tumor: STAT6 knockout in LLC1 cells. CON-TumorWTco: LLC1 cells were separated after 48 h of coculture with CD11b+ cells. CON-TumorSTAT6co: LLC1 cells were separated after 48 h of coculture with STAT6−/−CD11b+ cells for analysis of IL-4 expression. Si-TumorWTco: STAT6−/−LLC1 cells were separated after 48 h cocultured with STAT6+/+CD11b+ cells for analysis. Si-TumorSTAT6co: STAT6−/−LLC1 cells were separated after 48 h of coculture with STAT6−/−CD11b+ cells for analysis. CON-CD11bWTco: STAT6+/+CD11b+ cells were separated after 48 h of coculture with STAT6+/+LLC1 cells. CON-CD11bSTAT6co: STAT6+/+CD11b+ cells were separated after 48 h of coculture with STAT6−/−LLC1 cells. Si-CD11bWTco: STAT6−/−CD11b+ cells were separated after 48 h of coculture with STAT6+/+LLC1 cells. Si-CD11bSTAT6co: STAT6−/−CD11b+ cells were separated after 48 h of coculture with STAT6−/−LLC1 cells for analysis of IL-4 expression. (E–H) CCK8 proliferation analysis of human lung cancer-derived cells (A549, H1299, SPC-A1) and mouse lung cancer-derived cells (LLC1) after genetic knockdown of STAT6. The knockdown efficiencies of si-STAT6 in A549, H1299, SPC-A1, and LLC1 were 85, 90, 97.5, and 88%, respectively, as verified by RT-PCR. (I,J) Representative results of cell cycle analysis in WT and si-STAT6 groups. (K,L) Comparative percentages of cells in G1, S, and G2/M between WT and STAT6−/− groups in A549 and LLC1 cells. (M) Flow cytometry analysis of apoptosis. (N) Percentages of apoptotic cells in the WT and STAT6−/− groups (annexin-V-positive, PI-positive or -negative). (O) Percentages of early apoptotic cells (annexin-V-positive, PI-negative). si-STAT6, STAT6 knockdown.
Figure 8
Figure 8
Cytokines play a role in signal transducer and activator of transcription 6 (STAT6) −/−-mediated macrophage polarization. (A) Relative mRNA expression of iNOS in CD11b+ cells when cocultured with LLC1 cells. (B) Relative mRNA expression of Arg1 in CD11b+ cells when cocultured with LLC1 cells. (C,D) Expression of iNOS and Arg1 in groups of wild type and STAT6−/− mice. (E) Percentage of M1 cells in bone marrow-derived macrophages after 7 days of culture with 10 ng/ml exogenous interleukin (IL)-4. (F) Percentage of M2 cells in bone marrow-derived macrophages after 7 days of culture with 10 ng/ml exogenous IL-4. (G) Relative mRNA expression of IL-1β in bone marrow-derived macrophages after 7 days of culture with 10 ng/ml exogenous IL-4. (H) Relative mRNA expression of IL-6 in bone marrow-derived macrophages after 7 days of culture with 10 ng/ml exogenous IL-4. (I) Relative mRNA expression of IL-10 in bone marrow-derived macrophages after 7 days of culture with 10 ng/ml exogenous IL-4. (J) LLC1 cells (lower plates) were cocultured with macrophages (upper plates) using Transwell plates. Cell proliferation of LLC1 cells was analyzed by CCK8 with or without stimulation by exogenous IL-4. *P < 0.05, **P < 0.01, ***P < 0.001.
Figure 9
Figure 9
Flow diagram illustrating the main idea of this study. Activation of signal transducer and activator of transcription 6 (STAT6) signaling in CD11b+ cells increases the secretion of IL-4, promotes differentiation to M2 myeloid cell, and suppresses M1 polarization. M2 myeloid cells promote cancer cell proliferation and interleukin (IL)-4 secretion in tumor cells, which creates a positive feedback loop. IL-4 binding to the IL-4 receptor begins the next positive feedback loop. The black arrow indicates the promotive effect, and the red line indicates the suppressive effect. CD11b+ cells are represented by the red cells among the tumor cells.

Similar articles

Cited by

References

    1. Miller KD, Siegel RL, Lin CC, Mariotto AB, Kramer JL, Rowland JH, et al. . Cancer treatment and survivorship statistics. CA Cancer J Clin. (2016) 66:271–89. 10.3322/caac.21349 - DOI - PubMed
    1. Torre LA, Bray F, Siegel RL, Ferlay J, Lortet-Tieulent J, Jemal A. Global cancer statistics. CA Cancer J Clin. (2015) 65:87–108. 10.3322/caac.21262 - DOI - PubMed
    1. Winter H, van den Engel NK, Rusan M, Schupp N, Poehlein CH, Hu HM, et al. . Active-specific immunotherapy for non-small cell lung cancer. J Thorac Dis. (2011) 3:105–14. 10.3978/j.issn.2072-1439.2010.12.06 - DOI - PMC - PubMed
    1. Wang M, Zhao J, Zhang L, Wei F, Lian Y, Wu Y, et al. . Role of tumor microenvironment in tumorigenesis. J Cancer. (2017) 8:761–73. 10.7150/jca.17648 - DOI - PMC - PubMed
    1. Ansel KM, Djuretic I, Tanasa B, Rao A. Regulation of Th2 differentiation and Il4 locus accessibility. Annu Rev Immunol. (2006) 24:607–56. 10.1146/annurev.immunol.23.021704.115821 - DOI - PubMed

Publication types