A functional investigation of the suppression of CpG and UpA dinucleotide frequencies in plant RNA virus genomes
- PMID: 31797900
- PMCID: PMC6892864
- DOI: 10.1038/s41598-019-54853-0
A functional investigation of the suppression of CpG and UpA dinucleotide frequencies in plant RNA virus genomes
Abstract
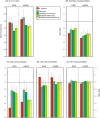
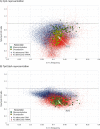
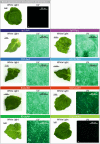
Frequencies of CpG and UpA dinucleotides in most plant RNA virus genomes show degrees of suppression comparable to those of vertebrate RNA viruses. While pathways that target CpG and UpAs in HIV-1 and echovirus 7 genomes and restrict their replication have been partly characterised, whether an analogous process drives dinucleotide underrepresentation in plant viruses remains undetermined. We examined replication phenotypes of compositionally modified mutants of potato virus Y (PVY) in which CpG or UpA frequencies were maximised in non-structural genes (including helicase and polymerase encoding domains) while retaining protein coding. PYV mutants with increased CpG dinucleotide frequencies showed a dose-dependent reduction in systemic spread and pathogenicity and up to 1000-fold attenuated replication kinetics in distal sites on agroinfiltration of tobacco plants (Nicotiana benthamiana). Even more extraordinarily, comparably modified UpA-high mutants displayed no pathology and over a million-fold reduction in replication. Tobacco plants with knockdown of RDP6 displayed similar attenuation of CpG- and UpA-high mutants suggesting that restriction occurred independently of the plant siRNA antiviral responses. Despite the evolutionary gulf between plant and vertebrate genomes and encoded antiviral strategies, these findings point towards the existence of novel virus restriction pathways in plants functionally analogous to innate defence components in vertebrate cells.
Conflict of interest statement
The authors declare no competing interests.
Figures


Similar articles
-
The dinucleotide composition of the Zika virus genome is shaped by conflicting evolutionary pressures in mammalian hosts and mosquito vectors.PLoS Biol. 2021 Apr 19;19(4):e3001201. doi: 10.1371/journal.pbio.3001201. eCollection 2021 Apr. PLoS Biol. 2021. PMID: 33872300 Free PMC article.
-
Plant Virus Genome Is Shaped by Specific Dinucleotide Restrictions That Influence Viral Infection.mBio. 2020 Feb 18;11(1):e02818-19. doi: 10.1128/mBio.02818-19. mBio. 2020. PMID: 32071264 Free PMC article.
-
RNA virus attenuation by codon pair deoptimisation is an artefact of increases in CpG/UpA dinucleotide frequencies.Elife. 2014 Dec 9;3:e04531. doi: 10.7554/eLife.04531. Elife. 2014. PMID: 25490153 Free PMC article.
-
Does the Zinc Finger Antiviral Protein (ZAP) Shape the Evolution of Herpesvirus Genomes?Viruses. 2021 Sep 17;13(9):1857. doi: 10.3390/v13091857. Viruses. 2021. PMID: 34578438 Free PMC article. Review.
-
CRISPR technology to combat plant RNA viruses: A theoretical model for Potato virus Y (PVY) resistance.Microb Pathog. 2019 Aug;133:103551. doi: 10.1016/j.micpath.2019.103551. Epub 2019 May 22. Microb Pathog. 2019. PMID: 31125685 Review.
Cited by
-
Synonymous Dinucleotide Usage: A Codon-Aware Metric for Quantifying Dinucleotide Representation in Viruses.Viruses. 2020 Apr 20;12(4):462. doi: 10.3390/v12040462. Viruses. 2020. PMID: 32325924 Free PMC article.
-
The dinucleotide composition of the Zika virus genome is shaped by conflicting evolutionary pressures in mammalian hosts and mosquito vectors.PLoS Biol. 2021 Apr 19;19(4):e3001201. doi: 10.1371/journal.pbio.3001201. eCollection 2021 Apr. PLoS Biol. 2021. PMID: 33872300 Free PMC article.
-
Mechanisms of Attenuation by Genetic Recoding of Viruses.mBio. 2021 Jan 5;12(1):e02238-20. doi: 10.1128/mBio.02238-20. mBio. 2021. PMID: 33402534 Free PMC article. Review.
-
Compositional biases in RNA viruses: Causes, consequences and applications.Wiley Interdiscip Rev RNA. 2022 Mar;13(2):e1679. doi: 10.1002/wrna.1679. Epub 2021 Jun 21. Wiley Interdiscip Rev RNA. 2022. PMID: 34155814 Free PMC article. Review.
-
Versatility of the Zinc-Finger Antiviral Protein (ZAP) As a Modulator of Viral Infections.Int J Biol Sci. 2024 Aug 26;20(12):4585-4600. doi: 10.7150/ijbs.98029. eCollection 2024. Int J Biol Sci. 2024. PMID: 39309436 Free PMC article. Review.
References
-
- Atkinson NJ, Witteveldt J, Evans DJ, Simmonds P. The influence of CpG and UpA dinucleotide frequencies on RNA virus replication and characterization of the innate cellular pathways underlying virus attenuation and enhanced replication. Nucleic acids research. 2014;42:4527–4545. doi: 10.1093/nar/gku075. - DOI - PMC - PubMed
MeSH terms
Substances
Grants and funding
LinkOut - more resources
Full Text Sources
Miscellaneous

