Global, regional, and national prevalence and disability-adjusted life-years for infertility in 195 countries and territories, 1990-2017: results from a global burden of disease study, 2017
- PMID: 31790362
- PMCID: PMC6932903
- DOI: 10.18632/aging.102497
Global, regional, and national prevalence and disability-adjusted life-years for infertility in 195 countries and territories, 1990-2017: results from a global burden of disease study, 2017
Abstract
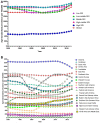
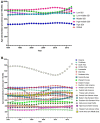
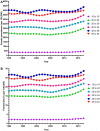
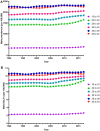
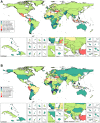
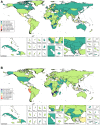
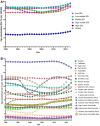
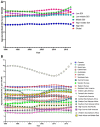
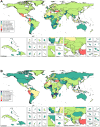
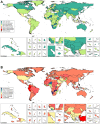
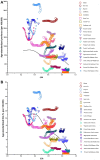
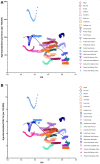
To provide comprehensive estimates of the global, regional, and national burden of infertility from 1990 to 2017, using findings from a 2017 study on the global burden of disease (GBD), we assessed the burden of infertility in 195 countries and territories from 1990 to 2017. DisMod-MR 2.1 is a Bayesian meta-regression method that estimates non-fatal outcomes using sparse and heterogeneous epidemiological data. Globally, the age-standardized prevalence rate of infertility increased by 0.370% per year for females and 0.291% per year for males from 1990 to 2017. Additionally, age-standardized disability-adjusted life-years (DALYs) of infertility increased by 0.396% per year for females and 0.293% per year for males during the observational period. An increasing trend to these burden estimates was observed throughout the all socio-demographic index (SDI) countries. Interestingly, we found that high SDI countries had the lowest level of prevalence and DALYs in both genders. However, the largest increasing trend was observed in high-SDI countries for females. By contrast, low-SDI countries had the largest increasing trend in males. Negative associations were observed between these burden estimates and the SDI level. The global disease burden of infertility has been increasing throughout the period from 1990 to 2017.
Keywords: disability-adjusted life-years; female infertility; global burden of disease study; male infertility; prevalence.
Conflict of interest statement
Figures
Similar articles
-
The global, regional, and national burden of benign prostatic hyperplasia in 204 countries and territories from 2000 to 2019: a systematic analysis for the Global Burden of Disease Study 2019.Lancet Healthy Longev. 2022 Nov;3(11):e754-e776. doi: 10.1016/S2666-7568(22)00213-6. Epub 2022 Oct 20. Lancet Healthy Longev. 2022. PMID: 36273485 Free PMC article.
-
Global, regional, and national trends in osteoarthritis disability-adjusted life years (DALYs) from 1990 to 2019: a comprehensive analysis of the global burden of disease study.Public Health. 2024 Jan;226:261-272. doi: 10.1016/j.puhe.2023.10.030. Epub 2023 Dec 21. Public Health. 2024. PMID: 38134839
-
The global, regional, and national burden of inflammatory bowel disease in 195 countries and territories, 1990-2017: a systematic analysis for the Global Burden of Disease Study 2017.Lancet Gastroenterol Hepatol. 2020 Jan;5(1):17-30. doi: 10.1016/S2468-1253(19)30333-4. Epub 2019 Oct 21. Lancet Gastroenterol Hepatol. 2020. PMID: 31648971 Free PMC article.
-
Global, regional and national burden of inflammatory bowel disease in 204 countries and territories from 1990 to 2019: a systematic analysis based on the Global Burden of Disease Study 2019.BMJ Open. 2023 Mar 28;13(3):e065186. doi: 10.1136/bmjopen-2022-065186. BMJ Open. 2023. PMID: 36977543 Free PMC article. Review.
-
Global burden and risk factors of musculoskeletal disorders among adolescents and young adults in 204 countries and territories, 1990-2019.Autoimmun Rev. 2023 Aug;22(8):103361. doi: 10.1016/j.autrev.2023.103361. Epub 2023 May 23. Autoimmun Rev. 2023. PMID: 37230312 Review.
Cited by
-
Association between Perfluoroalkyl and Polyfluoroalkyl Substances and Women's Infertility, NHANES 2013-2016.Int J Environ Res Public Health. 2022 Nov 20;19(22):15348. doi: 10.3390/ijerph192215348. Int J Environ Res Public Health. 2022. PMID: 36430067 Free PMC article.
-
Disposable paper-based microfluidics for fertility testing.iScience. 2022 Aug 18;25(9):104986. doi: 10.1016/j.isci.2022.104986. eCollection 2022 Sep 16. iScience. 2022. PMID: 36105592 Free PMC article. Review.
-
Mediterranean Diet as a Shield against Male Infertility and Cancer Risk Induced by Environmental Pollutants: A Focus on Flavonoids.Int J Mol Sci. 2022 Jan 29;23(3):1568. doi: 10.3390/ijms23031568. Int J Mol Sci. 2022. PMID: 35163492 Free PMC article. Review.
-
Genetic diversity in the IZUMO1-JUNO protein-receptor pair involved in human reproduction.PLoS One. 2021 Dec 8;16(12):e0260692. doi: 10.1371/journal.pone.0260692. eCollection 2021. PLoS One. 2021. PMID: 34879103 Free PMC article.
-
Using GnRH agonists in combination with hCG in antagonist ART cycles: A SCOPING Review of recent evidences.JBRA Assist Reprod. 2023 Aug 14;27(4):717-26. doi: 10.5935/1518-0557.20230029. Online ahead of print. JBRA Assist Reprod. 2023. PMID: 37579268 Free PMC article. Review.
References
-
- Centers for Disease Control and Prevention. National Public Health Action Plan for the Detection, Prevention, and Management of Infertility. Atlanta, Georgia: Centers for Disease Control and Prevention; June 2014.
-
- Zegers-Hochschild F, Adamson GD, de Mouzon J, Ishihara O, Mansour R, Nygren K, Sullivan E, Vanderpoel S, and International Committee for Monitoring Assisted Reproductive Technology, and World Health Organization. International Committee for Monitoring Assisted Reproductive Technology (ICMART) and the World Health Organization (WHO) revised glossary of ART terminology, 2009. Fertil Steril. 2009; 92:1520–24. 10.1016/j.fertnstert.2009.09.009 - DOI - PubMed
-
- Gerrits T, Van Rooij F, Esho T, Ndegwa W, Goossens J, Bilajbegovic A, Jansen A, Kioko B, Koppen L, Kemunto Migiro S, Mwenda S, Bos H. Infertility in the Global South: raising awareness and generating insights for policy and practice. Facts Views Vis Obgyn. 2017; 9:39–44. 10.1007/978-3-030-24864-2_4 - DOI - PMC - PubMed
Publication types
MeSH terms
LinkOut - more resources
Full Text Sources
Medical

