. 2019 Nov 27;11(520):eaax7350.
doi: 10.1126/scitranslmed.aax7350.

Early antiretroviral therapy in neonates with HIV-1 infection restricts viral reservoir size and induces a distinct innate immune profile

Affiliations

Early antiretroviral therapy in neonates with HIV-1 infection restricts viral reservoir size and induces a distinct innate immune profile

Pilar Garcia-Broncano et al. Sci Transl Med. .

Abstract

Neonatal HIV-1 infection is associated with rapidly progressive and frequently fatal immune deficiency if left untreated. Immediate institution of antiretroviral therapy (ART), ideally within hours after birth, may restrict irreversible damage to the developing neonatal immune system and possibly provide opportunities for facilitating drug-free viral control during subsequent treatment interruptions. However, the virological and immunological effects of ART initiation within hours after delivery have not been systematically investigated. We examined a unique cohort of neonates with HIV-1 infection from Botswana who started ART shortly after birth and were followed longitudinally for about 2 years in comparison to control infants started on treatment during the first year after birth. We demonstrate multiple clear benefits of rapid antiretroviral initiation, including an extremely small reservoir of intact proviral sequences, a reduction in abnormal T cell immune activation, a more polyfunctional HIV-1-specific T cell response, and an innate immune profile that displays distinct features of improved antiviral activity and is associated with intact proviral reservoir size. Together, these data offer rare insight into the evolutionary dynamics of viral reservoir establishment in neonates and provide strong empirical evidence supporting the immediate initiation of ART for neonates with HIV-1 infection.


Conflict of interest statement

Competing interests: D.R.K. has received consulting honoraria and/or research support from Gilead, Merck, and ViiV. M.L. has received speaking and consulting honoraria from Merck and Gilead. The remaining authors declare that they have no competing interests.

Figures

Fig. 1.
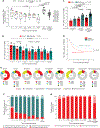
Fig. 1.. Immediate antiretroviral treatment initiation in neonates with HIV-1 infection leads to markedly reduced HIV-1 reservoirs.
(A and B) Longitudinal analysis of cell-associated HIV-1 DNA (A) (determined by ddPCR) and genome-intact or defective proviral sequences (B) (determined by single-genome, near–full-length next-generation sequencing) in neonates with antepartum (AP; n = 9) and peripartum (PP; n = 1) HIV-1 infection at indicated time points after initiation of ART. Data from children with delayed treatment initiation (Controls; median of 93 weeks after treatment initiation, n = 10) and from long-term ART–treated adults (median of 16 years after treatment initiation, n = 31) are shown for comparison in (A). (C) Cross-sectional comparison of the relative frequency of genome-intact and defective proviral sequences in children with early treatment initiation (EIT; week 84/96 after beginning of ART, n = 9), delayed treatment initiation (Controls; median of week 93 after beginning of ART, n = 10), and ART-treated adults with chronic HIV-1 infection (median of 16 years after beginning of ART, n = 31). Box-and-whisker plots in (A) reflect median, minimum, maximum, and interquartile ranges. Dot plots with mean and SEM are shown in (B) and (C). Significance was tested using a two-sided Kruskal-Wallis with post hoc Dunn’s multiple comparison test between longitudinal time points or groups and a Wilcoxon test between pairs. LOD, limit of detection, calculated as 0.2 (ddPCR) or 0.5 (single-genome near–full-length PCR) copies per maximum number of cells tested without target identification (see Materials and Methods for details). (D) Decay kinetics of intact and defective proviral HIV-1 sequences during the first 24 weeks after treatment initiation. Significance was calculated using a Wilcoxon signed-rank test. (E) Longitudinal analysis of viral reservoir composition in EIT neonates, as determined by single-genome near–full-length, next-generation sequencing in samples from indicated time points after treatment initiation. Data from control children (Controls) and ART-treated adults with chronic HIV-1 infection are shown for comparison. Each pie chart reflects relative contribution of HIV-1 amplification products with defined defects or genome-intact sequences. Total number of individual sequences included in each diagram is listed in the middle of each pie chart. (F and G) Bar diagrams reflecting proportions of individual proviral sequences detected once (nonclonal sequences) or detected more than once (clonal sequences) at a given time point. (F) Data from all (intact and defective) proviral sequences. (G) Data from genome-intact proviral sequences only. The total number of individual proviral sequences analyzed at each time point is listed above each bar.
Fig. 2.
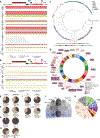
Fig. 2.. Viral sequence diversity and chromosomal integration sites in EIT study participants.
(A and B) Diagrams summarizing viral reservoir sequences aligned to the HXB2 reference from indicated study participants. Color coding reflects presence of intact and defective proviral species. Numbers of individual analyzed sequences are listed for each patient on the vertical axis. (A) All analyzed sequences (from any time point) from the EIT group. (B) All analyzed sequences (collected cross-sectionally at median of week 93) from children with delayed treatment initiation. (C) Circular maximum likelihood phylogenetic tree including all genome-intact sequences (n = 135) obtained from infants with early infant treatment (EIT) (“AP,” n = 102 or “PP,” n = 23; data from all time points shown) and from control children with delayed treatment initiation (“C,” n = 10). Identical proviruses are highlighted by gray boxes. w, week. (D) Circos plot reflecting chromosomal positioning of intact and defective proviral sequences from three EIT infants from whom sufficient PBMCs were available for proviral integration site analysis. All integration sites were determined using cell samples collected at baseline. Number of clonal sequences is highlighted by circular symbols. (E to H) Pie charts summarizing features of chromosomal integration sites for intact and defective proviruses described in (D). Data reflect proportions of intact and defective proviruses located in genic versus nongenic elements (E), in same or opposite orientation to host genes (genic sites only) (F), in introns versus exons (genic sites only) (G), and in indicated repetitive genome components [short interspersed nuclear element (SINE), long interspersed nuclear element (LINE), and DNA transposon (DNA)] (H). (I) Comparison between integration sites of intact proviruses from three EIT study participants and three long-term–treated adults described previously (17). Data reflect positions of intact proviruses in genic versus nongenic regions (top); the bottom panel indicates orientation of integrated proviruses relative to host genes (for proviruses in genic locations). Significance was tested using a two-sided Fisher’s exact test in (E) to (I). In (E) to (I), clonal sequences were only counted once. (J) Venn diagram reflecting the overlap between genes harboring HIV-1 integration sites described in this study and previously described independent integration sites by Wagner et al. (n = 288) (28), Maldarelli et al. (n = 1230) (27), Marini et al. (n = 156 hotspot genes) (29), and Einkauf et al. (n = 131) (17). (K) Sunburst chart representing the functional classification of genes targeted for retroviral integration by type and predicted location of encoded gene products. N/A, not available.
Fig. 3.
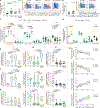
Fig. 3.. Association between NK cell responses and intact proviral reservoirs in EIT neonates.
(A and B) Left: Proportion of total NK cells in PBMCs. Right panels: Representative flow cytometry dot plots displaying subclassification of NK cells according to CD56 and CD16 expression in six subsets: I_CD56CD16dim, II_CD56CD16bright, III_CD56dimCD16dim, IV_CD56brightCD16low, V_CD56brightCD16, and VI_CD56dimCD16. Data from unstimulated PBMCs from EIT study participants (n = 8), HIV-1 unexposed–uninfected infants (HUU; n = 22), HIV-1 exposed–uninfected infants (HEU; n = 22) (all at week 12 after birth), and HIV-1–negative adults from Botswana (HIV-neg adults; n = 10) are shown in (A). Data from the EIT group (week 72, n = 9) and from controls with delayed time of treatment initiation (Controls; week 93, n = 10) are shown in (B). (C and D) Fractional abundance of defined NK cell populations in indicated study groups. Dot plots with median and interquartile ranges are indicated. PP-201, neonate with peripartum HIV-1 infection in the EIT study. (E to G) Violin plots reflecting proportions of NKG2D+ (E), NKp30+ (F), and CD161+ (G) NK cell subpopulations (defined by CD56 and CD16 expression) within the entire NK cell pool. Data from EIT, HEU, and HUU infants (all at week 12) and a reference cohort of adults with HIV-1 infection are shown. Significance was tested using a two-sided Kruskal-Wallis with post hoc Dunn’s multiple comparison test between groups or a two-sided Mann-Whitney U test between two groups. (H) Associations between proportions of indicated NK cell subsets relative to total NK cells and frequency of intact HIV-1 proviral sequences at week 12 after initiation of treatment among EIT infants. Linear regression coefficients are shown. Shaded areas represent 95% confidence intervals.
Fig. 4.
Fig. 4.. Frequency and phenotype of monocytes in EIT infants.
(A and B) Representative flow cytometry dot plots reflecting classification of monocytes according to CD16 and CD14 expression. (C and D) Proportion of total monocytes (C) and monocyte subsets (D) in EIT (n = 8), HUU (n = 22), and HEU (n = 22) infants (all at week 12) and HIV-1–negative adults (n = 10). (E and F) Proportion of total monocytes (E) and monocyte subsets (F) in EIT children at week 72 (n = 9) and from Controls at median of week 93 (n = 10). PP-201, neonate with peripartum HIV-1 infection in the EIT study. Dot plots with median and interquartile ranges are indicated. Significance was tested using a two-sided Kruskal-Wallis with post hoc Dunn’s multiple comparison test between groups or a two-sided Mann-Whitney U test between two groups. (G) Statistical association between frequency of intact HIV-1 proviruses and proportion of indicated monocyte subsets. Linear regression coefficients are shown. Shaded areas reflect 95% confidence intervals.
Fig. 5.
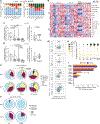
Fig. 5.. Early initiation of ART in neonates with HIV-1 infection promotes a more polyfunctional CD8+ T cell response.
(A) Proportion of indicated CD4+ and CD8+ T cell subsets in different patient groups (CM, central memory; EM, effector memory; and TEMRA, effector-memory T cells expressing CD45RA). Numbers after each study cohort reflect time (week) of cell sampling. Data from EIT study participants include n = 9 subjects at week 0, n = 8 subjects at week 12, n = 5 subjects at week 24, and n = 9 subjects at week 72; data from n = 10 HIV-negative adults, n = 10 Controls, n = 25 HUU, and n = 29 HEU were also included. (B) Heat map summarizing the surface expression of indicated phenotypic markers in CD4+ and CD8+ T cells from individual study groups. For each surface expression marker(s), data from the total T cell compartment and from naïve, central memory, effector memory, and effector-memory T cells expressing CD45RA are sequentially shown. (C and D) Box-and-whisker plots indicating the proportion of CD38+HLA-DR+–positive cells within the CD4+ and CD8+ T cell compartment. Left panels show data from EIT, HUU, and HEU infants (all at week 12) and HIV-1–negative adults; right panels indicate data from EIT children and Controls at weeks 72 to 93 after initiation of ART, respectively. Box-and-whisker plots reflect median, minimum, maximum, and interquartile ranges. PP-201, neonate with peripartum HIV-1 infection in the EIT study (E and F) Pie charts generated with SPICE reflecting proportions of CD4+ and CD8+ SEB (E) or HIV-1 Gag–specific (F) T cell responses with indicated functional profile (determined by Boolean combination gating) in children from the EIT study (n = 10, week 84), Controls (n = 8, week 93), and HIV-1–negative adults (n = 10). Pie chart colors represent number of effector molecules, whereas each effector function is represented by an arc. Significance was tested using a permutation test implemented in SPICE software. (G) Flow cytometry dot plots reflecting the expression of Tbet and Eomes in CD8+ T cells from a representative EIT study participant at indicated time points. (H) Bubble diagrams indicating the longitudinal evolution of Tbet and Eomes expression in CD8+ T cells from indicated time points in EIT study participants, control children, and HIV-1–negative adults. Pooled data from all analyzed samples in each study group are shown; data from n = 10 EIT subjects at week 1 (w1), n = 7 EIT subjects at week 8 (w8), n = 4 EIT subjects at week 48 (w48), n = 10 EIT subjects at week 84 (w84), n = 8 Controls (median of 93 weeks of ART), and n = 10 HIV-negative adults were included. (I) Bar diagram summarizing the expression of perforin and granzyme B (Grz B) in CD8+ T cells classified according to Tbet and Eomes expression in EIT children at week 84 and control children at a median of 93 weeks. Values are expressed as median and interquartile range. P values were calculated using the Mann-Whitney U test.

Similar articles

Cited by

References

    1. Siegfried N, van der Merwe L, Brocklehurst P, Sint TT, Antiretrovirals for reducing the risk of mother-to-child transmission of HIV infection. Cochrane Database Syst. Rev 2011, CD003510 (2011). - PubMed
    1. http://aidsinfo.unaids.org/.
    1. Newell ML, Coovadia H, Cortina-Borja M, Rollins N, Gaillard P; Francois Dabis for the Ghent International AIDS Society (IAS) working group on HIV infection in women and children, Mortality of infected and uninfected infants born to HIV-infected mothers in Africa: A pooled analysis. Lancet 364, 1236–1243 (2004). - PubMed
    1. Violari A, Cotton MF, Gibb DM, Babiker AG, Steyn J, Madhi SA, Jean-Philippe P, McIntyre JA; CHER Study Team, Early antiretroviral therapy and mortality among HIV-infected infants. N. Engl. J. Med 359, 2233–2244 (2008). - PMC - PubMed
    1. World Health Organization, Antiretroviral Therapy for HIV Infection in Infants and Children: Towards Universal Access—Recommendations for a Public Health Approach: 2010 Revision (World Health Organization, 2010); www.who.int/hiv/pub/paediatric/infants2010/en/index.html. - PubMed

Publication types

MeSH terms

Substances

LinkOut - more resources