. 2019 Dec;3(12):1743-1753.
doi: 10.1038/s41559-019-1046-4. Epub 2019 Nov 25.

Evolution of placental invasion and cancer metastasis are causally linked

Affiliations

Evolution of placental invasion and cancer metastasis are causally linked

Kshitiz et al. Nat Ecol Evol. 2019 Dec.

Erratum in

Abstract

Among mammals, placental invasion is correlated with vulnerability to malignancy. Animals with more invasive placentation (for example, humans) are more vulnerable to malignancy. To explain this correlation, we propose the hypothesis of 'Evolved Levels of Invasibility' proposing that the evolution of invasibility of stromal tissue affects both placental and cancer invasion. We provide evidence for this using an in vitro model. We find that bovine endometrial and skin fibroblasts are more resistant to invasion than are their human counterparts. Gene expression profiling identified genes with high expression in human but not in bovine fibroblasts. Knocking down a subset of them in human fibroblasts leads to stronger resistance to cancer cell invasion. Identifying the evolutionary determinants of stromal invasibility can provide important insights to develop rational antimetastatic therapeutics.


Conflict of interest statement

Competing Interests Statement: the authors declare no competing interests.

Figures

Extended Data Figure 1.
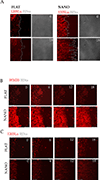
Extended Data Figure 1.. Nanotextured stromal invasion assay quantitatively and sensitively measures collective intrusion of cells into stroma.
(A) Time stamped images at 0 and 18 hours showing extent of invasion by DiI labeled 1205Lu cells (red) into BJ5ta stromal fibroblast monolayer (unlabeled) on flat and nanotextured substrata; Quantification shown in Fig. 1D. (B-C) Sensitive measurement of differences in invasion by nanotextured stromal invasion platform; Time stamped images at 0, 6, 12, and 18 hours showing extent of invasion by DiI labeled non-malignant WM35 (B), and malignant 1205Lu (C) cells into BJ5ta monolayer shown in both flat, and nanotextured cell patterned assay; Quantification shown in Fig. 1E.
Extended Data Figure 2.
Extended Data Figure 2.. Human and bovine trophoblasts exhibit different invasive potential into endometrial stroma.
Time stamped images showing extent of invasion of human choriocarcinoma derived trophoblasts, J3 (red) (A), and bovine trophoblasts, F3 (red) (B) into their respective endometrial stromal fibroblast monolayers at 0, and 48 hours.
Extended Data Figure 3.
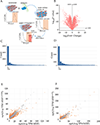
Extended Data Figure 3.. Human and bovine endometrial stromal fibroblasts respond differently to co-culture with trophoblasts.
(A) Experimental plan to isolate endometrial cells after co-culture with respective trophoblast; (B) Volcano plot showing fold change in genes between bovine vs human endometrial stromal fibroblasts, along with their significance depicted in p value. (C) P-value distribution of t-tests comparing human ESFs with and without co-culture with HTR8 trophoblast cells. (D) P-value distribution of t-tests comparing bovine ESFs with and without co-culture with F3 trophoblast cells. In both C and D, note that thin right hand tail of the distribution, which indicates that a large number of genes are differentially expressed in response to the presence of the corresponding trophoblast cells. (E-F) Scatter plots showing relative TPM values of genes between (E) hESF and hESF co-cultured with HTR8, and (F) bESF and bESF co-cultured with F3; Red dots refer to individual gene transcripts abundance significantly different in between the compared conditions.
Extended Data Figure 4.
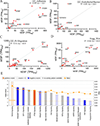
Extended Data Figure 4.. Human and bovine endometrial stromal fibroblasts do not appear to differentially respond to their respective trophoblasts by regulating cell-cell adhesion.
Gene ontology analysis of individual genes belonging to GO_Adherens (A), GO_Endothelial Barrier (B), GO_Fibroblast Migration (C), and Kegg ontology for Wnt Signaling (D) for hESF and bESF shown with their relative TPM values; Also are shown the coefficient of determinant, R2 for the linear regression between TPM values of hESF and bESF in a given gene-sets, along with the standard deviation of the residuals, Sy.x. (E) Ingenuity Pathway Analysis of selected signaling pathways differentially activated in hESF and bESF; Shown are –log(p-values) of genes in the respective pathways differentially activated, while the color depicts the z-score.
Extended Data Figure 5.
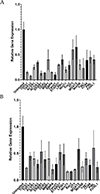
Extended Data Figure 5.. siRNA induced gene knockdown reduces transcript levels in hESFs and BJ5ta cells.
qRTPCR results showing the percentage knockdown of transcript levels in hESF (A) and BJ5ta (B), calculated using DDCt method, compared using GAPDH as housekeeping gene with scrambled siRNA as control. For both A, and B, n = 4 biological replicates.
Figure 1.
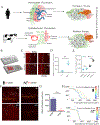
Figure 1.. An experimental platform to test the hypothesis of Evolved Levels of Invasibility (ELI).
(A) Schematic describing the ELI hypothesis. Placentation in humans is hemochorial, wherein the placental trophoblasts invade into the maternal stroma reaching the blood supply. In contrast, in cows and other boroeutherians, placentation has recently evolved to be epitheliochorial, where the trophoblast epithelium attaches to the endometrial epithelium, but does not invade the maternal interstitium. The ELI paradigm states that bovine stroma has evolved to resist invasion compared to human stroma, and therefore secondarily limits cancer metastasis. (B) Schematic showing a cell patterning nanotextured platform to quantitatively and sensitively measure collective invasion into stroma; Stromal cells and invasive cells are patterned by a PDMS stencil into juxtaposed monolayers heterotypically interacting with each other, and imaged using live cell microscopy to observe collective cell invasion into the stroma. (C) Time course images showing invasion of 1205Lu malignant melanoma cells (red) into BJ5ta human skin fibroblasts (unlabeled) for 18 hours on a flat substrate vs a nanotextured substrate; Quantification of the extent of invasion per unit length of heterotypic intercellular interaction shown in (D). (E) Quantification of the extent of invasion of non-malignant WM35 and malignant 1205Lu melanoma into a monolayer of BJ5ta human skin fibroblasts on flat and nanotextured substrata. (F) Time course images showing invasion of human choriocarcinoma derived trophoblasts, J3 (red) into human endometrial stromal fibroblasts (unlabeled); and bovine trophoblasts, F3 (red) into bovine stromal fibroblasts (unlabeled) for 48 hours; See Figure S2 for phase-contrast and Supplementary Movies for dynamics of invasion; Quantification of the extent of invasion of trophoblasts into the respective stromal monolayer shown in (G). (H) Time course dynamic analysis showing cumulative invasion of J3 and F3 into respective species-specific endometrial stromal monolayers. In D, E, and G, n = 4 independent biological replicates; Statistical comparisons made using Student’s t-tests **: p < 0.01, ***: p < 0.001; Error bars denote standard error of the mean (s.e.m.).
Figure 2.
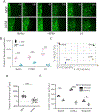
Figure 2.. Bovine stroma resists trophoblast and melanoma invasion.
(A) Representative time course images of human trophoblasts BeWo, extravillous trophoblasts HTR8 (green) and bovine trophoblasts F3 (green) invading into endometrial stromal fibroblasts of the respective species for 18 hours; White traces show the boundary of the invasive fronts; Quantification of the extent of invasion for either trophoblasts shown in (B). (C) Principal Component Analysis (PCA) of the gene expression data from skin fibroblasts from human (BJ5ta) and bovine (bSkFb), and endometrial stromal fibroblasts from human (hESF) and bovine (bESF); 3 biological replicates were used for RNA Sequencing. (D) Extent of invasion of malignant A375 cells into BJ5ta and bSkFb monolayers measured over 24 hours. (E) Extent of invasion of other well characterized human melanoma cell lines into BJ5ta and bSkFb monolayers after 18 hours of observation. In B, C, E, n = 3, and in D, n = 8 independent biological replicates; Statistical comparisons made using Student’s t-tests *: p < 0.05, **: p < 0.01, ***: p < 0.001; Error bars denote standard error of the mean (s.e.m.).
Figure 3.
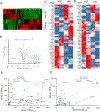
Figure 3.. Transcriptomic analysis of bovine and human endometrial stromal fibroblasts reveals differential response to trophoblasts.
(A) Heat map of gene expression differences of human and bovine endometrial stromal fibroblasts with and without co-culture with HTR8 and F3 trophoblast cells respectively. (B) Volcano plot showing fold differences in the TPM values of bESFs vs hESFs co-cultured with the respective trophoblasts, color coded for relevant gene ontologies. (C-D) Heatmap showing expression of genes in hESFs and bESFs with or without co-culture with HTR8 and F3 respectively, belonging to the gene-sets chemokine (C) and chemokine receptors (D). TPM values of genes significantly different in hESFs and bESFs for KEGG pathways for TGFB (E), and non-cannonical WNT signaling (F); For each gene, TPM values before and after co-culture are shown in green, and red dots respectively; Arrows show the change in TPM values due to trophoblast co-culture; Also are shown coefficient of determination, R2 for the linear regression of TPM values between hESF and bESF, and the standard deviation of the residuals, Sy.x.
Figure 4.
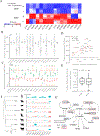
Figure 4.. Induced resistance to invasion in human stroma by evolutionarily inspired gene silencing.
(A) Heatmap showing selected set of genes used for gene silencing in human stromal fibroblasts; Shown are z-score of TPM values for each transcript. (B-E) siRNA based gene knockdown in human stroma to induce expression similar to bESF increases resistance to invasion; (B) Extent of invasion of HTR8 cells into hESFs subjected to siRNA mediated gene silencing measured over 24 hours using nanotextured platform; (C) Extent of invasion measured for 18 hours (red), and 36 hours (green) using nanotextured platform for A375 invasion into BJ5ta subjected to siRNA induced silencing of individual genes; Each dot in B, C reflects an individual invasion observation, Error bars show s.e.m., Statistical comparisons made with scrambled siRNA using Student-t-test; *: P < 0.05, **: P < 0.01, ***: P < .0001. (D) Correlation shown between the extent of invasion of HTR8 into hESF, and A375 into BJ5ta for each siRNA based gene silencing; (E) Average extent of invasion in hESF and BJ5ta for the above 20 gene silencing normalized to the extent of invasion observed for control scrambled siRNA knockdown in either human stromal cells; Whiskers show min to max values; horizonal bar is the median; average values are indicated by +, box is 25 to 75 percentile. (F) Relative transcript levels of the selected genes in various boroeutherians species compared to their most common ancestor; red colored bars denote decrease, and green bars show difference in sqrt(TPM) values vs the common ancestor; mya refers to million years ago. (G) Network of WNT signaling and its interaction with TGFB pathway showing previously known interactions, mapped with the gene silencing induced resistance in hESF, and BJ5ta stromal cells.

Similar articles

Cited by

References

    1. Chaturvedi P et al. Hypoxia-inducible factor-dependent breast cancer-mesenchymal stem cell bidirectional signaling promotes metastasis. The Journal of clinical investigation 123, 189–205, doi:10.1172/JCI64993 (2013). - DOI - PMC - PubMed
    1. Colegio OR et al. Functional polarization of tumour-associated macrophages by tumour-derived lactic acid. Nature 513, 559–563, doi:10.1038/nature13490 (2014). - DOI - PMC - PubMed
    1. Zhang W & Huang P Cancer-stromal interactions: role in cell survival, metabolism and drug sensitivity. Cancer biology & therapy 11, 150–156 (2011). - PMC - PubMed
    1. Luga V & Wrana JL Tumor-stroma interaction: Revealing fibroblast-secreted exosomes as potent regulators of Wnt-planar cell polarity signaling in cancer metastasis. Cancer research 73, 6843–6847, doi:10.1158/0008-5472.CAN-13-1791 (2013). - DOI - PubMed
    1. Murray MJ & Lessey BA Embryo implantation and tumor metastasis: common pathways of invasion and angiogenesis. Seminars in reproductive endocrinology 17, 275–290, doi:10.1055/s-2007-1016235 (1999). - DOI - PubMed

Publication types

LinkOut - more resources