

A novel network control model for identifying personalized driver genes in cancer
- PMID: 31765387
- PMCID: PMC6901264
- DOI: 10.1371/journal.pcbi.1007520
A novel network control model for identifying personalized driver genes in cancer
Abstract
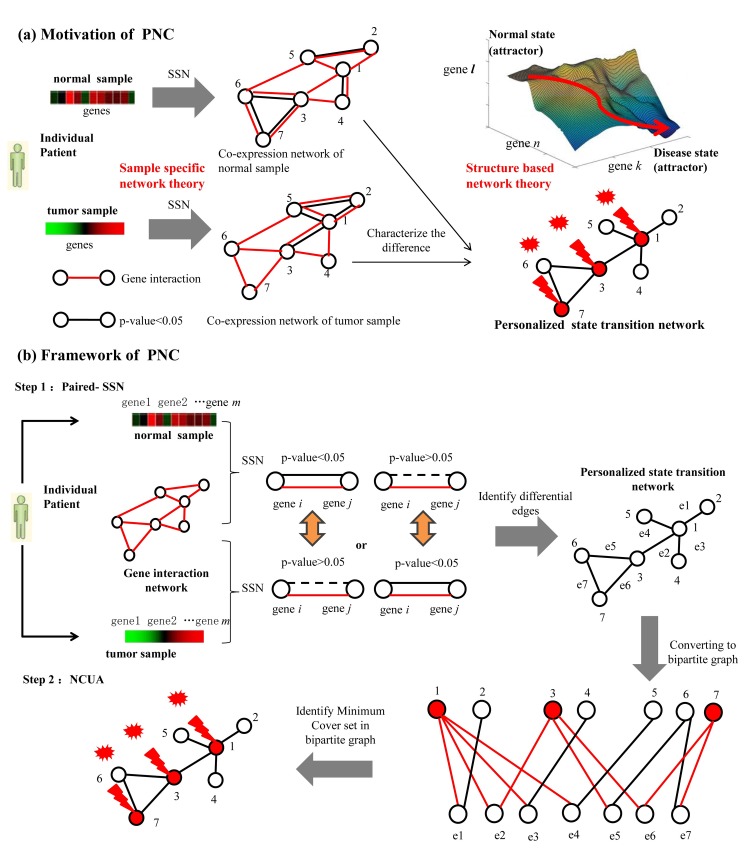
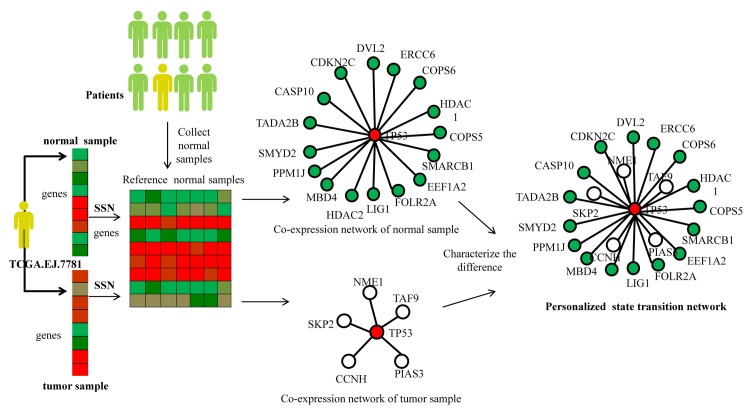
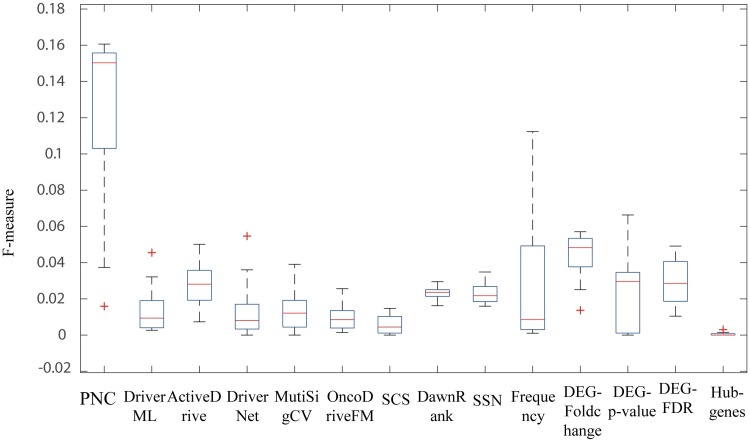
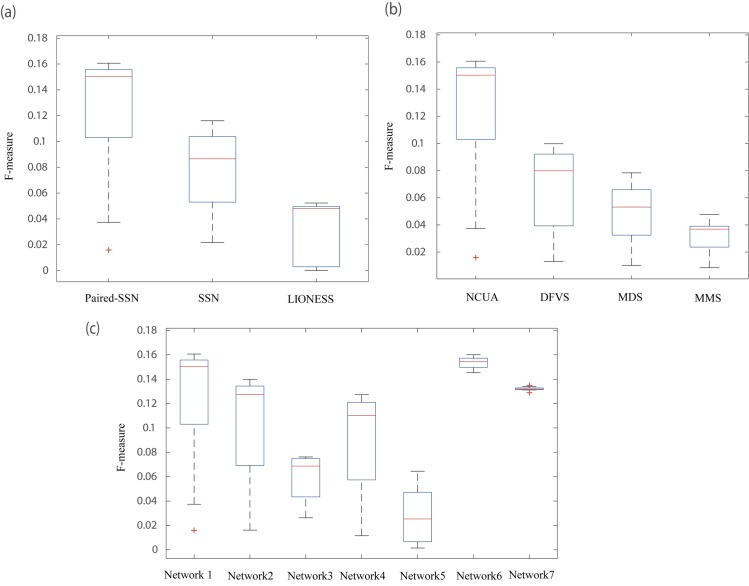
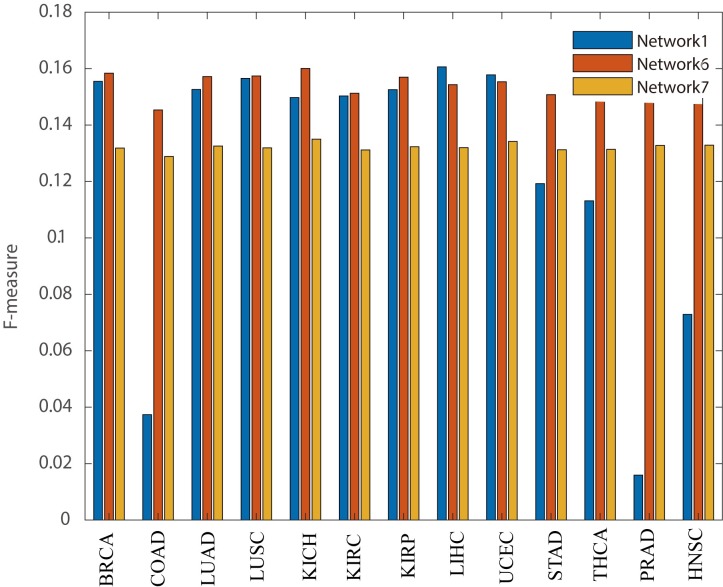
Although existing computational models have identified many common driver genes, it remains challenging to identify the personalized driver genes by using samples of an individual patient. Recently, the methods of exploiting the structure-based control principles of complex networks provide new clues for identifying minimum number of driver nodes to drive the state transition of large-scale complex networks from an initial state to the desired state. However, the structure-based network control methods cannot be directly applied to identify the personalized driver genes due to the unknown network dynamics of the personalized system. Here we proposed the personalized network control model (PNC) to identify the personalized driver genes by employing the structure-based network control principle on genetic data of individual patients. In PNC model, we firstly presented a paired single sample network construction method to construct the personalized state transition network for capturing the phenotype transitions between healthy and disease states. Then, we designed a novel structure-based network control method from the Feedback Vertex Sets-based control perspective to identify the personalized driver genes. The wide experimental results on 13 cancer datasets from The Cancer Genome Atlas firstly showed that PNC model outperforms current state-of-the-art methods, in terms of F-measures for identifying cancer driver genes enriched in the gold-standard cancer driver gene lists. Furthermore, these results showed that personalized driver genes can be explored by their network characteristics even when they are hidden factors in transcription and mutation profiles. Our PNC gives novel insights and useful tools into understanding the tumor heterogeneity in cancer. The PNC package and data resources used in this work can be freely downloaded from https://github.com/NWPU-903PR/PNC.
Conflict of interest statement
The authors have declared that no competing interests exist.
Figures
Similar articles
-
Discovering personalized driver mutation profiles of single samples in cancer by network control strategy.Bioinformatics. 2018 Jun 1;34(11):1893-1903. doi: 10.1093/bioinformatics/bty006. Bioinformatics. 2018. PMID: 29329368
-
Prioritization of cancer driver gene with prize-collecting steiner tree by introducing an edge weighted strategy in the personalized gene interaction network.BMC Bioinformatics. 2022 Aug 16;23(1):341. doi: 10.1186/s12859-022-04802-y. BMC Bioinformatics. 2022. PMID: 35974311 Free PMC article.
-
DGMP: Identifying Cancer Driver Genes by Jointing DGCN and MLP from Multi-omics Genomic Data.Genomics Proteomics Bioinformatics. 2022 Oct;20(5):928-938. doi: 10.1016/j.gpb.2022.11.004. Epub 2022 Dec 1. Genomics Proteomics Bioinformatics. 2022. PMID: 36464123 Free PMC article.
-
Network control principles for identifying personalized driver genes in cancer.Brief Bioinform. 2020 Sep 25;21(5):1641-1662. doi: 10.1093/bib/bbz089. Brief Bioinform. 2020. PMID: 31711128 Review.
-
Predictive genomics: a cancer hallmark network framework for predicting tumor clinical phenotypes using genome sequencing data.Semin Cancer Biol. 2015 Feb;30:4-12. doi: 10.1016/j.semcancer.2014.04.002. Epub 2014 Apr 18. Semin Cancer Biol. 2015. PMID: 24747696 Review.
Cited by
-
Modular Screening Reveals Driver Induced Additive Mechanisms of Baicalin and Jasminoidin on Cerebral Ischemia Therapy.Front Cardiovasc Med. 2022 Feb 21;9:813983. doi: 10.3389/fcvm.2022.813983. eCollection 2022. Front Cardiovasc Med. 2022. PMID: 35265682 Free PMC article.
-
Performance assessment of sample-specific network control methods for bulk and single-cell biological data analysis.PLoS Comput Biol. 2021 May 6;17(5):e1008962. doi: 10.1371/journal.pcbi.1008962. eCollection 2021 May. PLoS Comput Biol. 2021. PMID: 33956788 Free PMC article.
-
Perspectives on studying molecular adaptations of amphibians in the genomic era.Zool Res. 2020 Jul 18;41(4):351-364. doi: 10.24272/j.issn.2095-8137.2020.046. Zool Res. 2020. PMID: 32390371 Free PMC article. Review.
-
Identifying cancer driver genes in individual tumours.Comput Struct Biotechnol J. 2023 Oct 13;21:5028-5038. doi: 10.1016/j.csbj.2023.10.019. eCollection 2023. Comput Struct Biotechnol J. 2023. PMID: 37867967 Free PMC article. Review.
-
Personalized Driver Gene Prediction Using Graph Convolutional Networks with Conditional Random Fields.Biology (Basel). 2024 Mar 14;13(3):184. doi: 10.3390/biology13030184. Biology (Basel). 2024. PMID: 38534453 Free PMC article.
References
Publication types
MeSH terms
Grants and funding
LinkOut - more resources
Full Text Sources
Other Literature Sources
