Functional Enhancers Shape Extrachromosomal Oncogene Amplifications
- PMID: 31761532
- PMCID: PMC7241652
- DOI: 10.1016/j.cell.2019.10.039
Functional Enhancers Shape Extrachromosomal Oncogene Amplifications
Abstract
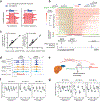
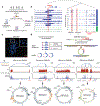
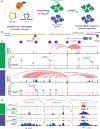
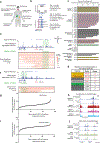
Non-coding regions amplified beyond oncogene borders have largely been ignored. Using a computational approach, we find signatures of significant co-amplification of non-coding DNA beyond the boundaries of amplified oncogenes across five cancer types. In glioblastoma, EGFR is preferentially co-amplified with its two endogenous enhancer elements active in the cell type of origin. These regulatory elements, their contacts, and their contribution to cell fitness are preserved on high-level circular extrachromosomal DNA amplifications. Interrogating the locus with a CRISPR interference screening approach reveals a diversity of additional elements that impact cell fitness. The pattern of fitness dependencies mirrors the rearrangement of regulatory elements and accompanying rewiring of the chromatin topology on the extrachromosomal amplicon. Our studies indicate that oncogene amplifications are shaped by regulatory dependencies in the non-coding genome.
Keywords: EGFR; MYC; MYCN; double minute; enhancer; epigenetic; extrachromosomal DNA; glioblastoma; oncogene amplification.
Copyright © 2019 Elsevier Inc. All rights reserved.
Conflict of interest statement
DECLARATION OF INTERESTS
The authors declare no competing interests.
Figures


Comment in
-
Circles with a Point: New Insights into Oncogenic Extrachromosomal DNA.Cancer Cell. 2020 Feb 10;37(2):145-146. doi: 10.1016/j.ccell.2020.01.008. Cancer Cell. 2020. PMID: 32049044
Similar articles
-
Extrachromosomal Circular DNAs, Amplified Oncogenes, and CRISPR-Cas9 System.Mol Pharmacol. 2022 Oct;102(4):209-215. doi: 10.1124/molpharm.122.000553. Epub 2022 Aug 8. Mol Pharmacol. 2022. PMID: 35940609
-
Enhancer hijacking determines extrachromosomal circular MYCN amplicon architecture in neuroblastoma.Nat Commun. 2020 Nov 16;11(1):5823. doi: 10.1038/s41467-020-19452-y. Nat Commun. 2020. PMID: 33199677 Free PMC article.
-
Detection of Enhancer-Associated Rearrangements Reveals Mechanisms of Oncogene Dysregulation in B-cell Lymphoma.Cancer Discov. 2015 Oct;5(10):1058-71. doi: 10.1158/2159-8290.CD-15-0370. Epub 2015 Jul 30. Cancer Discov. 2015. PMID: 26229090 Free PMC article.
-
Oncogene amplification in tumor cells.Adv Cancer Res. 1986;47:235-81. doi: 10.1016/s0065-230x(08)60201-8. Adv Cancer Res. 1986. PMID: 3022564 Review. No abstract available.
-
Transcriptional dysregulation by aberrant enhancer activation and rewiring in cancer.Cancer Sci. 2021 Jun;112(6):2081-2088. doi: 10.1111/cas.14884. Epub 2021 May 1. Cancer Sci. 2021. PMID: 33728716 Free PMC article. Review.
Cited by
-
Temporal chromatin accessibility changes define transcriptional states essential for osteosarcoma metastasis.Nat Commun. 2023 Nov 8;14(1):7209. doi: 10.1038/s41467-023-42656-x. Nat Commun. 2023. PMID: 37938582 Free PMC article.
-
Topography of transcriptionally active chromatin in glioblastoma.Sci Adv. 2021 Apr 30;7(18):eabd4676. doi: 10.1126/sciadv.abd4676. Print 2021 Apr. Sci Adv. 2021. PMID: 33931443 Free PMC article.
-
Extrachromosomal circular DNA in colorectal cancer: biogenesis, function and potential as therapeutic target.Oncogene. 2023 Mar;42(13):941-951. doi: 10.1038/s41388-023-02640-7. Epub 2023 Mar 1. Oncogene. 2023. PMID: 36859558 Free PMC article. Review.
-
Pan-cancer analysis of mutations in open chromatin regions and their possible association with cancer pathogenesis.Cancer Med. 2022 Oct;11(20):3902-3916. doi: 10.1002/cam4.4749. Epub 2022 Apr 13. Cancer Med. 2022. PMID: 35416406 Free PMC article.
-
Plasticity of Extrachromosomal and Intrachromosomal BRAF Amplifications in Overcoming Targeted Therapy Dosage Challenges.Cancer Discov. 2022 Apr 1;12(4):1046-1069. doi: 10.1158/2159-8290.CD-20-0936. Cancer Discov. 2022. PMID: 34930786 Free PMC article.
References
-
- Bao S, Wu Q, McLendon RE, Hao Y, Shi Q, Hjelmeland AB, Dewhirst MW, Bigner DD, and Rich JN (2006). Glioma stem cells promote radioresistance by preferential activation of the DNA damage response. Nature 444, 756–760. - PubMed
-
- Beroukhim R, Zhang X, and Meyerson M. (2016). Copy number alterations unmasked as enhancer hijackers. Nat Genet 49, 5–6. - PubMed
-
- Boeva V, Louis-Brennetot C, Peltier A, Durand S, Pierre-Eugene C, Raynal V, Etchevers HC, Thomas S, Lermine A, Daudigeos-Dubus E, et al. (2017). Heterogeneity of neuroblastoma cell identity defined by transcriptional circuitries. Nat Genet 49, 1408–1413. - PubMed
Publication types
MeSH terms
Substances
Grants and funding
- R01 CA169117/CA/NCI NIH HHS/United States
- R01 CA204279/CA/NCI NIH HHS/United States
- TL1 TR002549/TR/NCATS NIH HHS/United States
- R01 CA160356/CA/NCI NIH HHS/United States
- TL1 TR000441/TR/NCATS NIH HHS/United States
- R01 DA043980/DA/NIDA NIH HHS/United States
- R01 CA143237/CA/NCI NIH HHS/United States
- R01 NS087913/NS/NINDS NIH HHS/United States
- R01 NS103434/NS/NINDS NIH HHS/United States
- R01 CA193677/CA/NCI NIH HHS/United States
- R01 CA171652/CA/NCI NIH HHS/United States
- R01 NS089272/NS/NINDS NIH HHS/United States
- F30 CA236313/CA/NCI NIH HHS/United States
- R35 CA197718/CA/NCI NIH HHS/United States
- T32 GM007250/GM/NIGMS NIH HHS/United States
- R01 CA154130/CA/NCI NIH HHS/United States
LinkOut - more resources
Full Text Sources
Other Literature Sources
Molecular Biology Databases
Research Materials
Miscellaneous

