

A single ChIP-seq dataset is sufficient for comprehensive analysis of motifs co-occurrence with MCOT package
- PMID: 31750523
- PMCID: PMC6868382
- DOI: 10.1093/nar/gkz800
A single ChIP-seq dataset is sufficient for comprehensive analysis of motifs co-occurrence with MCOT package
Abstract
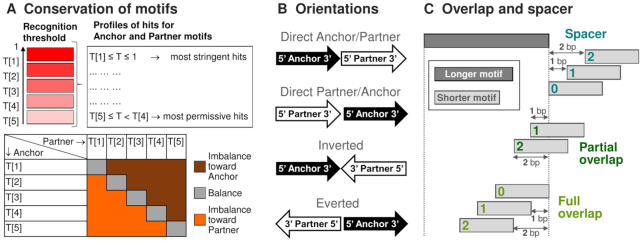
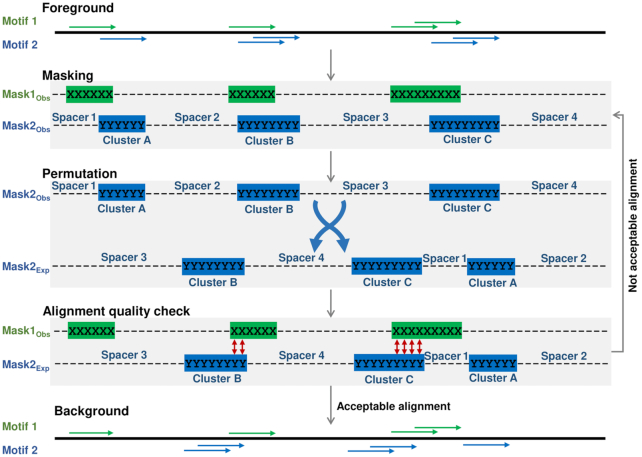
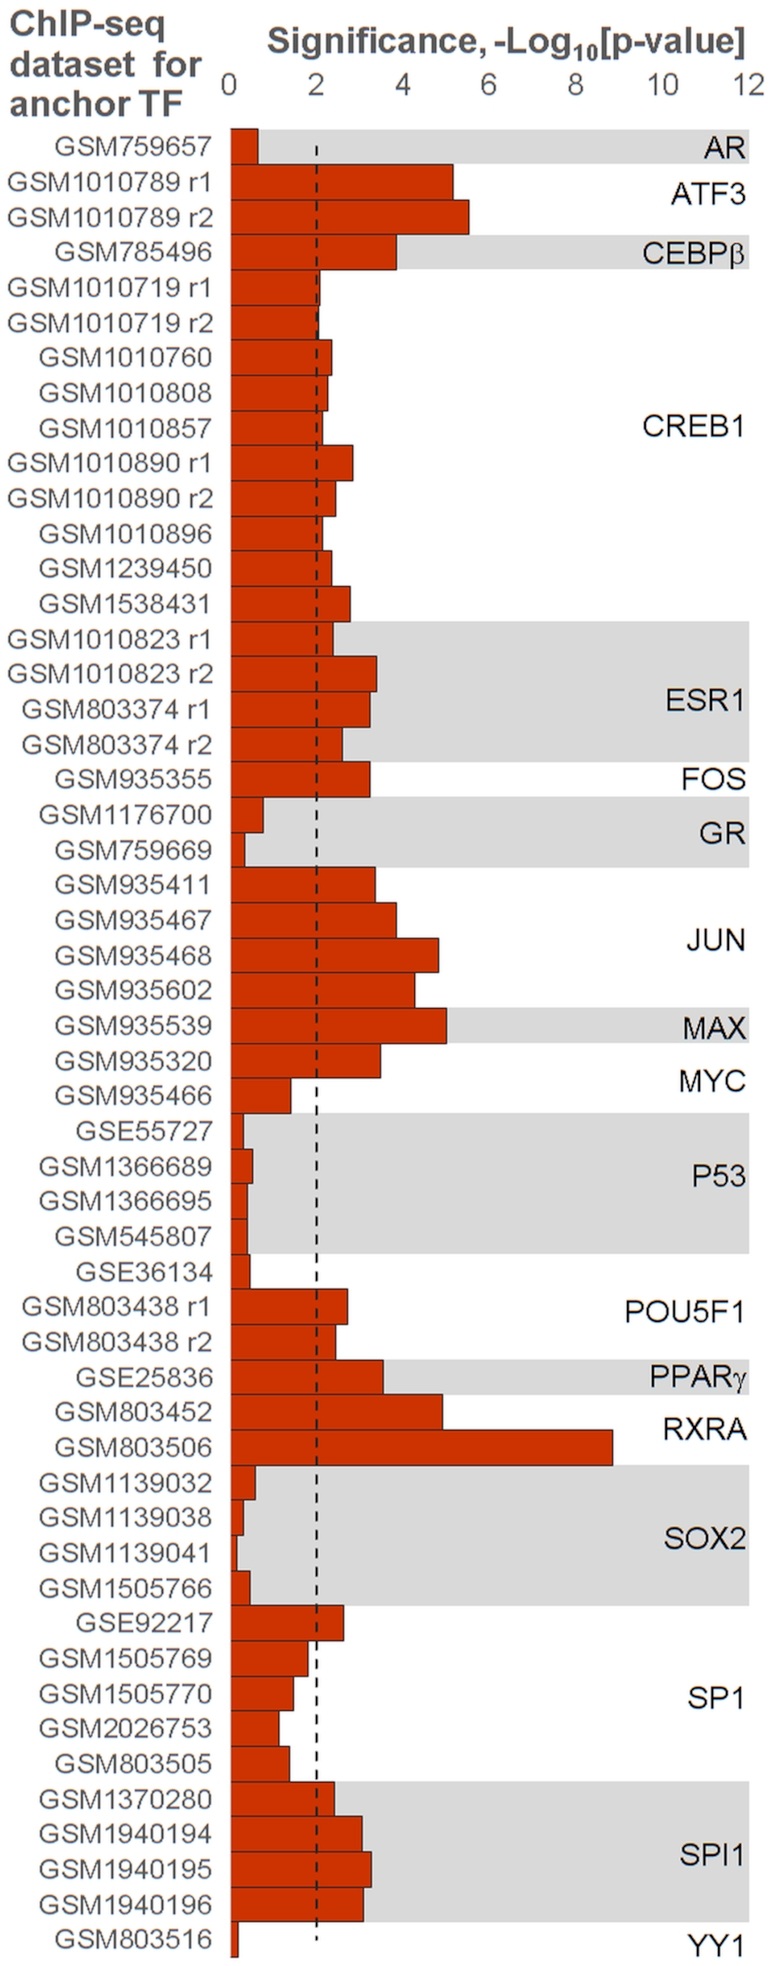
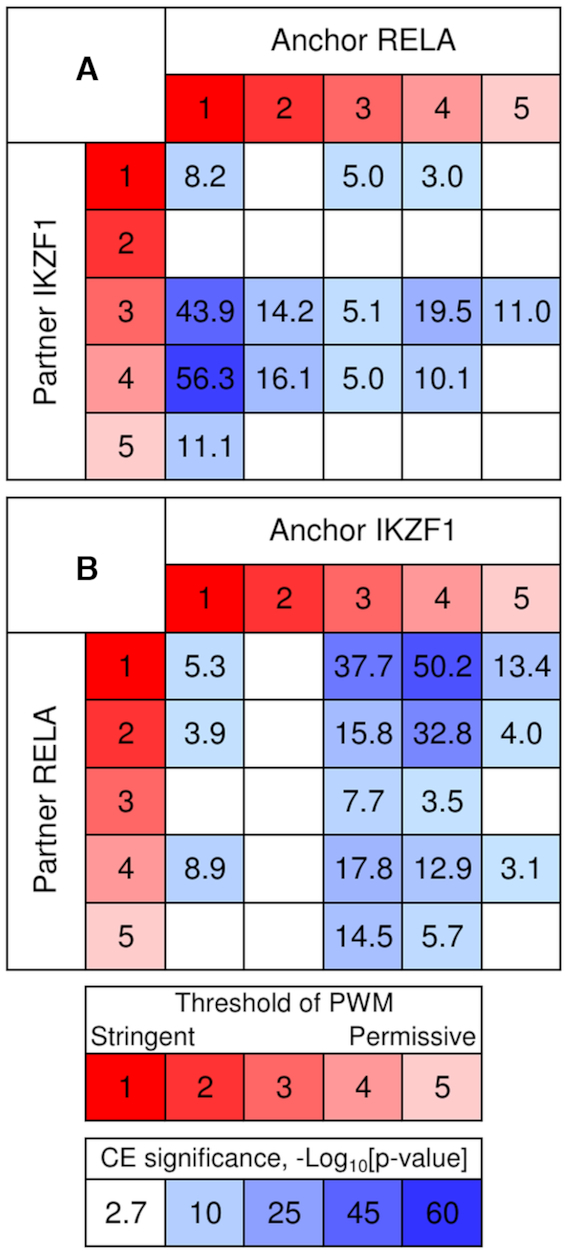
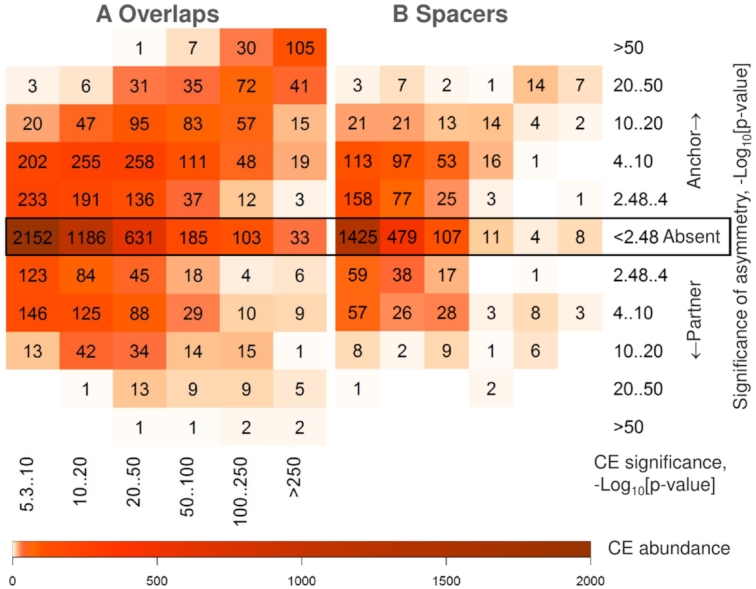
Recognition of composite elements consisting of two transcription factor binding sites gets behind the studies of tissue-, stage- and condition-specific transcription. Genome-wide data on transcription factor binding generated with ChIP-seq method facilitate an identification of composite elements, but the existing bioinformatics tools either require ChIP-seq datasets for both partner transcription factors, or omit composite elements with motifs overlapping. Here we present an universal Motifs Co-Occurrence Tool (MCOT) that retrieves maximum information about overrepresented composite elements from a single ChIP-seq dataset. This includes homo- and heterotypic composite elements of four mutual orientations of motifs, separated with a spacer or overlapping, even if recognition of motifs within composite element requires various stringencies. Analysis of 52 ChIP-seq datasets for 18 human transcription factors confirmed that for over 60% of analyzed datasets and transcription factors predicted co-occurrence of motifs implied experimentally proven protein-protein interaction of respecting transcription factors. Analysis of 164 ChIP-seq datasets for 57 mammalian transcription factors showed that abundance of predicted composite elements with an overlap of motifs compared to those with a spacer more than doubled; and they had 1.5-fold increase of asymmetrical pairs of motifs with one more conservative 'leading' motif and another one 'guided'.
© The Author(s) 2019. Published by Oxford University Press on behalf of Nucleic Acids Research.
Figures


Similar articles
-
Web-MCOT Server for Motif Co-Occurrence Search in ChIP-Seq Data.Int J Mol Sci. 2022 Aug 11;23(16):8981. doi: 10.3390/ijms23168981. Int J Mol Sci. 2022. PMID: 36012247 Free PMC article.
-
Asymmetric Conservation within Pairs of Co-Occurred Motifs Mediates Weak Direct Binding of Transcription Factors in ChIP-Seq Data.Int J Mol Sci. 2020 Aug 21;21(17):6023. doi: 10.3390/ijms21176023. Int J Mol Sci. 2020. PMID: 32825662 Free PMC article.
-
FisherMP: fully parallel algorithm for detecting combinatorial motifs from large ChIP-seq datasets.DNA Res. 2019 Jun 1;26(3):231-242. doi: 10.1093/dnares/dsz004. DNA Res. 2019. PMID: 30957858 Free PMC article.
-
Genome Wide Approaches to Identify Protein-DNA Interactions.Curr Med Chem. 2019;26(42):7641-7654. doi: 10.2174/0929867325666180530115711. Curr Med Chem. 2019. PMID: 29848263 Review.
-
An algorithmic perspective of de novo cis-regulatory motif finding based on ChIP-seq data.Brief Bioinform. 2018 Sep 28;19(5):1069-1081. doi: 10.1093/bib/bbx026. Brief Bioinform. 2018. PMID: 28334268 Review.
Cited by
-
Motif models proposing independent and interdependent impacts of nucleotides are related to high and low affinity transcription factor binding sites in Arabidopsis.Front Plant Sci. 2022 Jul 28;13:938545. doi: 10.3389/fpls.2022.938545. eCollection 2022. Front Plant Sci. 2022. PMID: 35968123 Free PMC article.
-
TF-COMB - Discovering grammar of transcription factor binding sites.Comput Struct Biotechnol J. 2022 Jul 21;20:4040-4051. doi: 10.1016/j.csbj.2022.07.025. eCollection 2022. Comput Struct Biotechnol J. 2022. PMID: 35983231 Free PMC article.
-
Integrating Peak Colocalization and Motif Enrichment Analysis for the Discovery of Genome-Wide Regulatory Modules and Transcription Factor Recruitment Rules.Front Genet. 2020 Feb 21;11:72. doi: 10.3389/fgene.2020.00072. eCollection 2020. Front Genet. 2020. PMID: 32153638 Free PMC article.
-
Analysis of auxin responses in the fern Ceratopteris richardii identifies the developmental phase as a major determinant for response properties.Development. 2024 Oct 15;151(20):dev203026. doi: 10.1242/dev.203026. Epub 2024 Sep 26. Development. 2024. PMID: 39324436 Free PMC article.
-
Candidate SNP Markers of Atherogenesis Significantly Shifting the Affinity of TATA-Binding Protein for Human Gene Promoters show stabilizing Natural Selection as a Sum of Neutral Drift Accelerating Atherogenesis and Directional Natural Selection Slowing It.Int J Mol Sci. 2020 Feb 5;21(3):1045. doi: 10.3390/ijms21031045. Int J Mol Sci. 2020. PMID: 32033288 Free PMC article.
References
-
- Morgunova E., Taipale J.. Structural perspective of cooperative transcription factor binding. Curr. Opin. Struct. Biol. 2017; 47:1–8. - PubMed
Publication types
MeSH terms
Substances
LinkOut - more resources
Full Text Sources
