Endoplasmic reticulum stress regulates epithelial‑mesenchymal transition in human lens epithelial cells
- PMID: 31746423
- PMCID: PMC6896292
- DOI: 10.3892/mmr.2019.10814
Endoplasmic reticulum stress regulates epithelial‑mesenchymal transition in human lens epithelial cells
Abstract
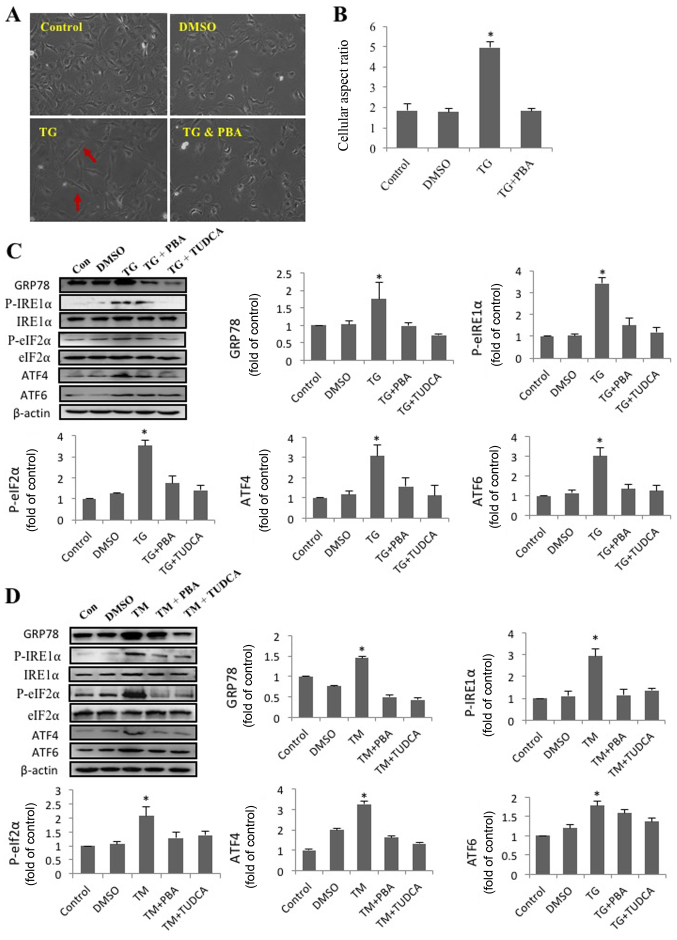
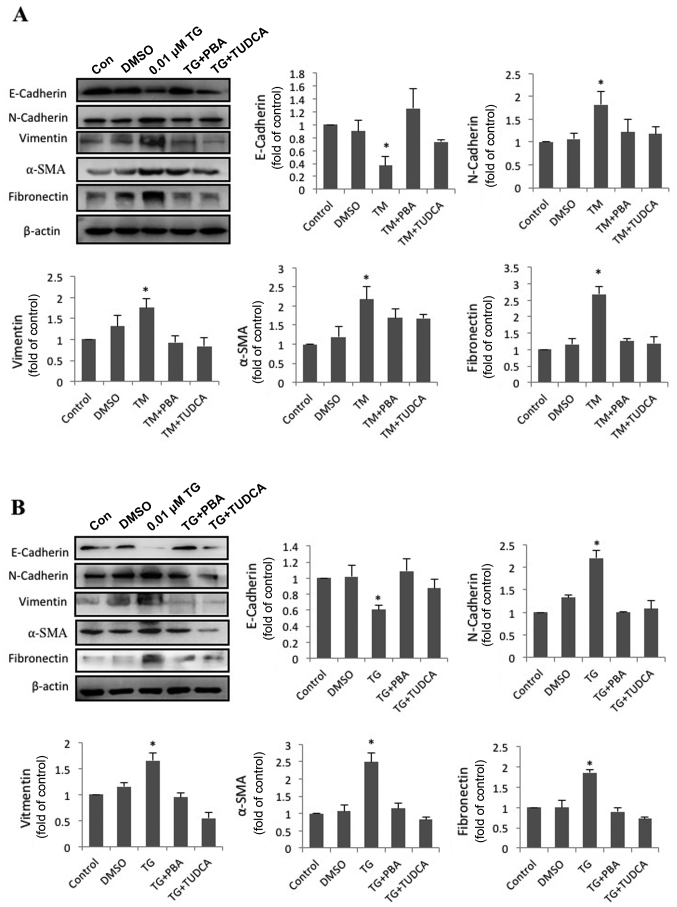
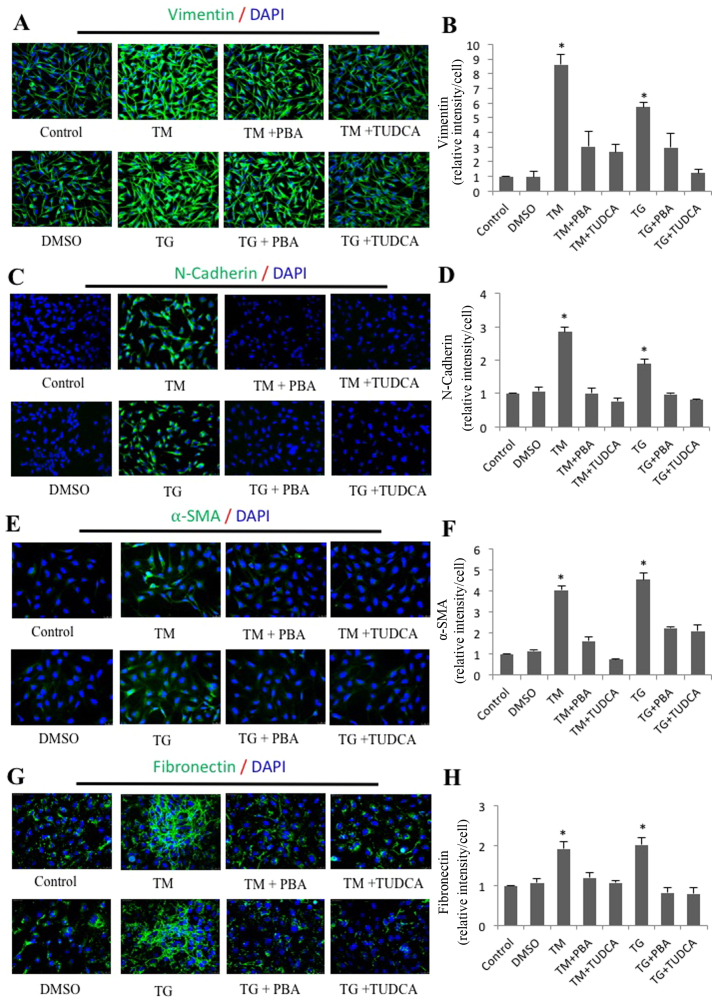
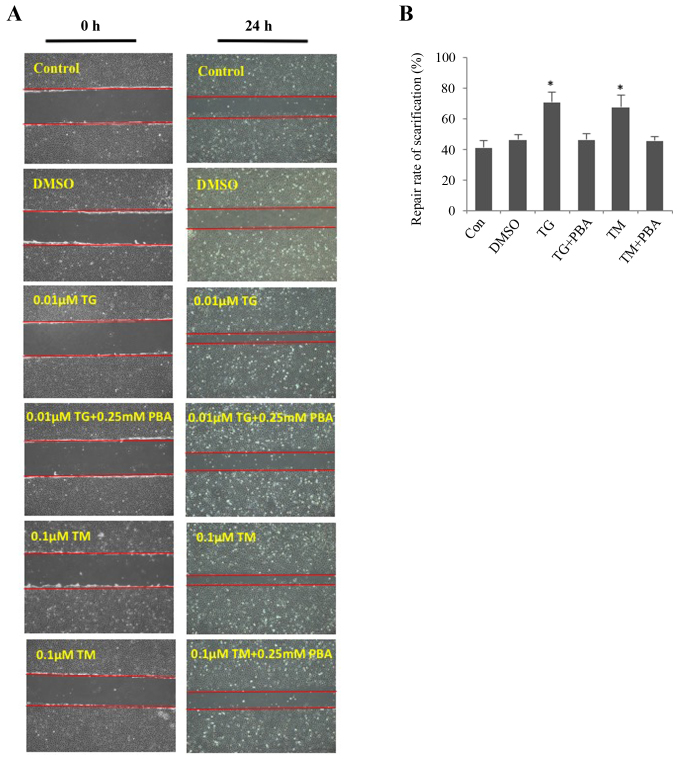
Epithelial‑to‑mesenchymal transition (EMT) of human lens epithelial cells (HLECs) serve an important role in cataract formation. The endoplasmic reticulum stress response (ER stress) has been demonstrated to regulate EMT in a number of tissues. The aim of the present study was to demonstrate the role of ER stress on EMT in HLECs. HLECs were treated with tunicamycin (TM) or thapsigargin (TG) to disturb ER homeostasis, and 4‑phenylbutyric acid (PBA) or sodium tauroursodeoxycholate (TUDCA) to restore ER homeostasis. Cell morphology was evaluated after 24 h. The long axis and aspect ratio of the cells were analyzed using ImageJ software. The results demonstrated that HLECs adopted an elongated morphology following treatment with TG, and the cellular aspect ratio increased. However, this morphological change was not observed following combination treatment with TG and PBA. Western blot analysis and immunofluorescence staining were used to measure the protein expression levels. A wound‑healing assay was performed to evaluate cell migration. Treatment with TM or TG increased the expression of the ER stress markers glucose‑regulated protein 78, phosphorylated eukaryotic initiation factor 2α, activating transcription factor (ATF)6, ATF4 and inositol‑requiring protein 1α and the EMT markers fibronectin, vimentin, α‑smooth muscle actin and neural cadherin. Furthermore, treatment with TM or TG decreased the expression of the epithelial cell marker epithelial cadherin and enhanced cell migration, which effects were inhibited following treatment with PBA or TUDCA. These results indicates that enhanced ER stress induced EMT and subsequently increased cell migration in HLECs in vitro.
Keywords: human lens epithelial cells; endoplasmic reticulum stress response; epithelial-to-mesenchymal transition; unfolded protein response.
Figures
Similar articles
-
Sestrin2 Protects Human Lens Epithelial Cells (HLECs) Against Apoptosis in Cataracts Formation: Interaction Between Endoplasmic Reticulum (ER) Stress and Oxidative Stress (OS) is Involved.Curr Eye Res. 2024 Sep;49(9):949-960. doi: 10.1080/02713683.2024.2352058. Epub 2024 May 23. Curr Eye Res. 2024. PMID: 38780907
-
Selenite cataracts: activation of endoplasmic reticulum stress and loss of Nrf2/Keap1-dependent stress protection.Biochim Biophys Acta. 2014 Sep;1842(9):1794-805. doi: 10.1016/j.bbadis.2014.06.028. Epub 2014 Jul 2. Biochim Biophys Acta. 2014. PMID: 24997453 Free PMC article.
-
5‑Nitro‑2‑(3‑phenylpropylamino) benzoic acid induces apoptosis of human lens epithelial cells via reactive oxygen species and endoplasmic reticulum stress through the mitochondrial apoptosis pathway.Int J Mol Med. 2021 Apr;47(4):59. doi: 10.3892/ijmm.2021.4892. Epub 2021 Feb 19. Int J Mol Med. 2021. PMID: 33604681 Free PMC article.
-
Endoplasmic reticulum stress induces epithelial-mesenchymal transition through autophagy via activation of c-Src kinase.Nephron Exp Nephrol. 2014;126(3):127-40. doi: 10.1159/000362457. Epub 2014 May 22. Nephron Exp Nephrol. 2014. PMID: 24863135
-
IL-32 induces epithelial-mesenchymal transition by triggering endoplasmic reticulum stress in A549 cells.BMC Pulm Med. 2020 Oct 23;20(1):278. doi: 10.1186/s12890-020-01319-z. BMC Pulm Med. 2020. PMID: 33097029 Free PMC article.
Cited by
-
Involvement of IGF1 in endoplasmic reticulum stress contributes to cataract formation through regulating Nrf2/NF-κB signaling.Funct Integr Genomics. 2023 Jul 3;23(3):220. doi: 10.1007/s10142-023-01152-7. Funct Integr Genomics. 2023. PMID: 37394478
-
Glutamate is effective in decreasing opacity formed in galactose-induced cataract model.Sci Rep. 2024 Feb 19;14(1):4123. doi: 10.1038/s41598-024-54559-y. Sci Rep. 2024. PMID: 38374148 Free PMC article.
-
Emerging roles of endoplasmic reticulum stress in the cellular plasticity of cancer cells.Front Oncol. 2023 Feb 20;13:1110881. doi: 10.3389/fonc.2023.1110881. eCollection 2023. Front Oncol. 2023. PMID: 36890838 Free PMC article. Review.
-
Ginsenoside Rb1 Ameliorated Bavachin-Induced Renal Fibrosis via Suppressing Bip/eIF2α/CHOP Signaling-Mediated EMT.Front Pharmacol. 2022 Jul 8;13:872474. doi: 10.3389/fphar.2022.872474. eCollection 2022. Front Pharmacol. 2022. PMID: 35873571 Free PMC article.
-
Amantamide C, an Antitrypanosomal Linear Lipopeptide from a Marine Okeania sp. Cyanobacterium.ACS Omega. 2024 Aug 15;9(34):36795-36801. doi: 10.1021/acsomega.4c05909. eCollection 2024 Aug 27. ACS Omega. 2024. PMID: 39220484 Free PMC article.
References
MeSH terms
Substances
LinkOut - more resources
Full Text Sources
Research Materials
Miscellaneous