Transcriptome sequencing of endometrium revealed alterations in mRNAs and lncRNAs after ovarian stimulation
- PMID: 31745762
- PMCID: PMC7000608
- DOI: 10.1007/s10815-019-01616-5
Transcriptome sequencing of endometrium revealed alterations in mRNAs and lncRNAs after ovarian stimulation
Abstract
Research question: Using RNA-sequencing analysis, we investigated the relationship between ovarian stimulation and endometrial transcriptome profiles during the window of implantation (WOI) to identify candidate predictive factors for the WOI and to optimize timing for embryo transfer.
Methods: Twelve women with normal basal hormone levels and regular ovulation were randomly assigned into three groups based on sampling time: late-proliferate phase (P group), and receptive phase in natural cycles (LH+7, N group) and stimulated cycles (hCG+7, S group). Transcriptome profiles of mRNAs and long non-coding RNAs (lncRNAs) were then compared among the three groups. Validation was performed using real-time qPCR.
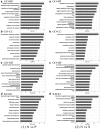
Results: Comparison of transcriptome profiles between the natural and stimulated endometrium revealed 173 differentially expressed genes (DEGs), with a > 2-fold change (FC) and p < 0.05, under the influence of supraphysiological estradiol (E2) induced by ovarian stimulation. By clustering and KEGG pathway analysis, molecules and pathways associated with endometrial receptivity were identified. Of the 39 DEGs common to the three groups, eight genes were validated using real-time PCR. ESR1, MMP10, and HPSE were previously reported to be associated with endometrial receptivity. In addition, three novel genes (IL13RA2, ZCCHC12, SRARP) and two lncRNAs (LINC01060, LINC01104) were new potential endometrial receptivity-related markers.
Conclusion: Using mRNA and lncRNA sequencing, we found that supraphysiological E2 levels from ovarian stimulation had a marked impact upon endometrial transcriptome profiles and may result in a shift of the WOI. The precise mechanisms underlying the supraphysiological hormone-induced shift of the WOI require further research.
Registration number: ChiCTR180001453.
Keywords: Endometrial receptivity; Ovarian stimulation; Window of implantation; lncRNAs; mRNAs.
Conflict of interest statement
The authors declare that they have no conflict of interest.
Figures


Similar articles
-
Construction of implantation failure related lncRNA-mRNA network and identification of lncRNA biomarkers for predicting endometrial receptivity.Int J Biol Sci. 2018 Jul 27;14(10):1361-1377. doi: 10.7150/ijbs.25081. eCollection 2018. Int J Biol Sci. 2018. PMID: 30123082 Free PMC article.
-
Endometrial transcriptome profiling of patients with recurrent implantation failure during hormone replacement therapy cycles.Front Endocrinol (Lausanne). 2024 Jan 30;14:1292723. doi: 10.3389/fendo.2023.1292723. eCollection 2023. Front Endocrinol (Lausanne). 2024. PMID: 38352249 Free PMC article.
-
Expression profile analysis of LncRNAs and mRNAs in pre-receptive endometrium of women with polycystic ovary syndrome undergoing in vitro fertilization-embryo transfer.BMC Med Genomics. 2024 Jan 19;17(1):26. doi: 10.1186/s12920-024-01806-w. BMC Med Genomics. 2024. PMID: 38243290 Free PMC article.
-
LnCRNAs in the Regulation of Endometrial Receptivity for Embryo Implantation.JBRA Assist Reprod. 2024 Aug 26;28(3):503-510. doi: 10.5935/1518-0557.20240038. JBRA Assist Reprod. 2024. PMID: 38875127 Free PMC article. Review.
-
Ovarian stimulation for in vitro fertilization alters the protein profile expression in endometrial secretion.Int J Clin Exp Pathol. 2013 Sep 15;6(10):1964-71. eCollection 2013. Int J Clin Exp Pathol. 2013. PMID: 24133574 Free PMC article. Review.
Cited by
-
The role of epigenetic mechanisms in the regulation of gene expression in the cyclical endometrium.Clin Epigenetics. 2021 May 25;13(1):116. doi: 10.1186/s13148-021-01103-8. Clin Epigenetics. 2021. PMID: 34034824 Free PMC article. Review.
-
Small Non-Coding RNAs as New Biomarkers to Evaluate the Quality of the Embryo in the IVF Process.Biomolecules. 2022 Nov 14;12(11):1687. doi: 10.3390/biom12111687. Biomolecules. 2022. PMID: 36421701 Free PMC article.
-
The distinct roles of zinc finger CCHC-type (ZCCHC) superfamily proteins in the regulation of RNA metabolism.RNA Biol. 2021 Dec;18(12):2107-2126. doi: 10.1080/15476286.2021.1909320. Epub 2021 May 4. RNA Biol. 2021. PMID: 33787465 Free PMC article. Review.
-
A systematic review of transcriptomic studies of the human endometrium reveals inconsistently reported differentially expressed genes.Reprod Fertil. 2023 Jun 1;4(3):e220115. doi: 10.1530/RAF-22-0115. Online ahead of print. Reprod Fertil. 2023. PMID: 37276176 Free PMC article.
-
Clinical and perinatal outcomes of fresh single-blastocyst-transfer cycles under an early follicular phase prolonged protocol according to day of trigger estradiol levels.PeerJ. 2021 Jul 26;9:e11785. doi: 10.7717/peerj.11785. eCollection 2021. PeerJ. 2021. PMID: 34395072 Free PMC article.
References
-
- Norwitz ER, Schust DJ, Fisher JS. Implantation and the survival of early pregnancy. N Engl J Med. 2001;345:1400–1408. - PubMed
-
- Rachel SMD. The receptivity of the endometrium to implementation. Journal of Obstetrics & Gynaecology of the British Empire. 2010;69(1):107–109. - PubMed
-
- Paulson Richard J. Hormonal induction of endometrial receptivity. Fertility and Sterility. 2011;96(3):530–535. - PubMed
-
- Macklon NS, Geraedts JPM, Fauser BCJM. Conception to ongoing pregnancy: The “black box” of early pregnancy loss. Hum Reprod Update. 2002;8:333–343. - PubMed
MeSH terms
Substances
LinkOut - more resources
Full Text Sources
Miscellaneous

