. 2019 Nov 19;9(1):17104.
doi: 10.1038/s41598-019-53176-4.

DDR1 autophosphorylation is a result of aggregation into dense clusters

Affiliations

DDR1 autophosphorylation is a result of aggregation into dense clusters

David S Corcoran et al. Sci Rep. .

Abstract

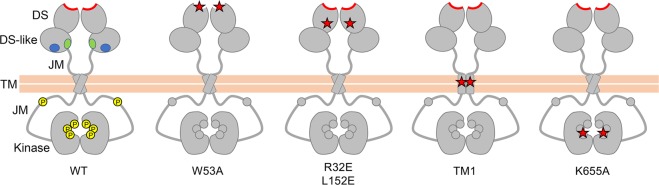
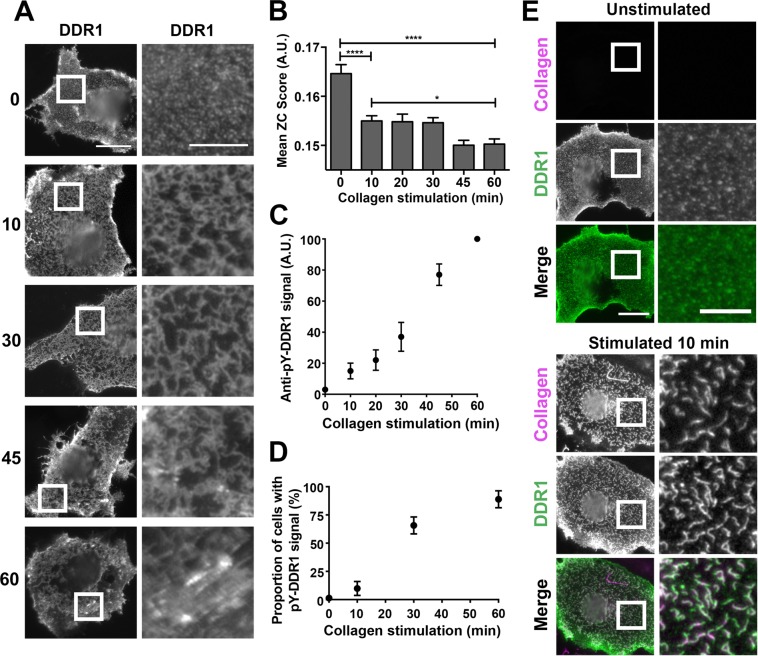
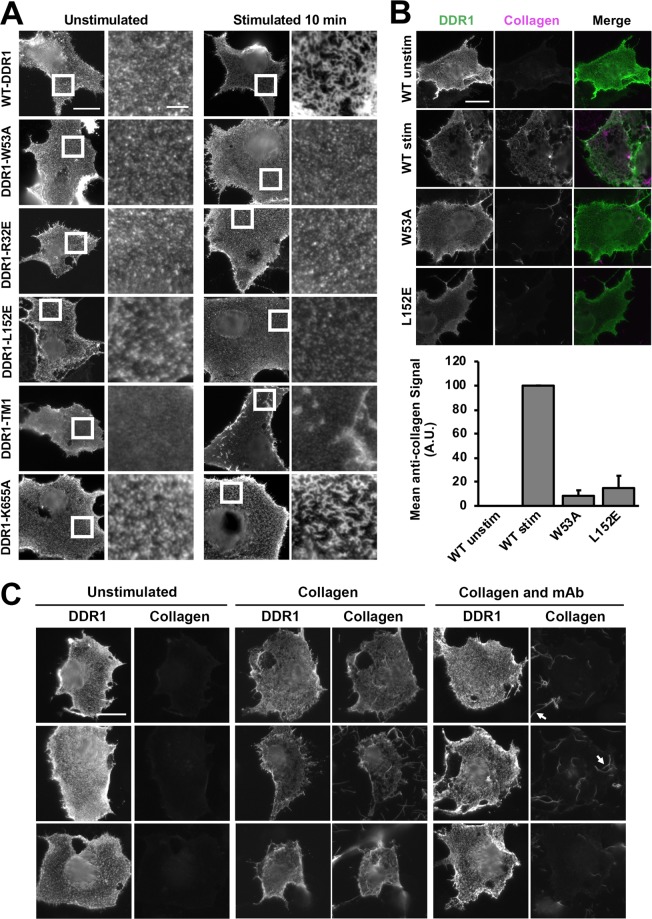
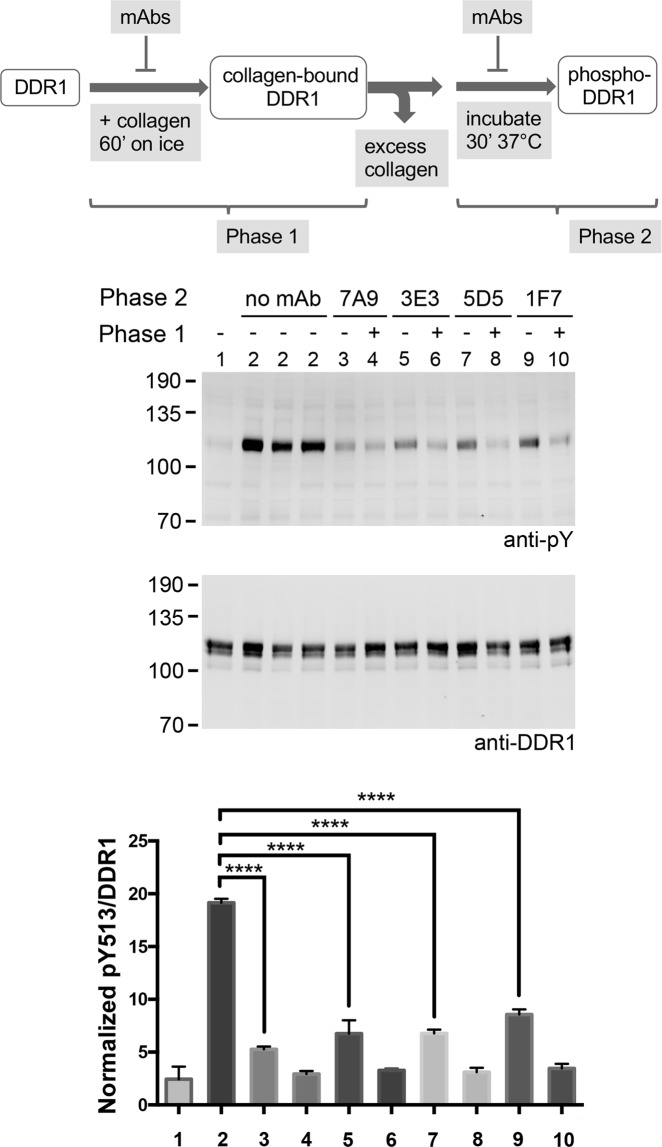
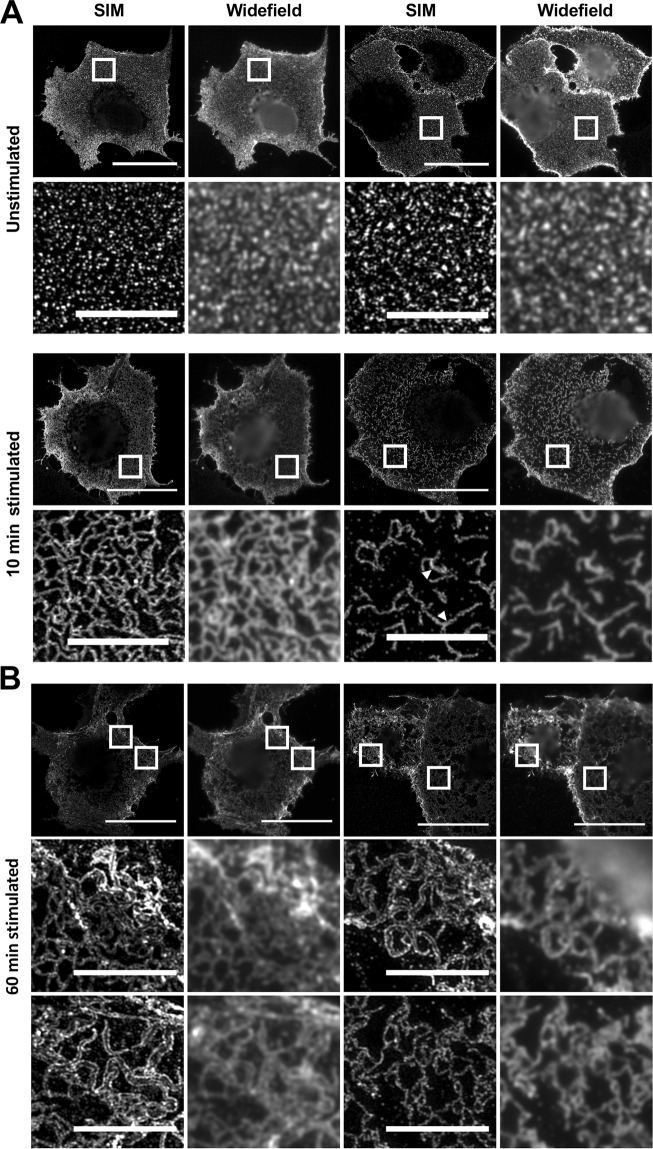
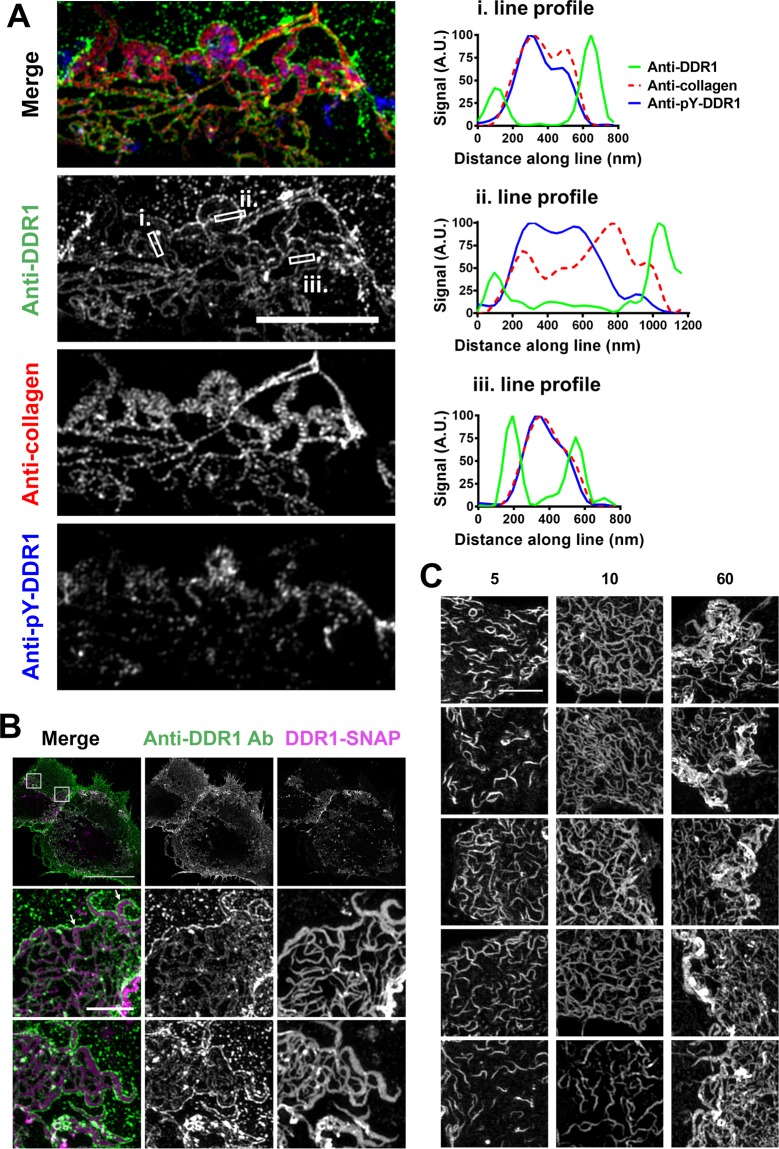
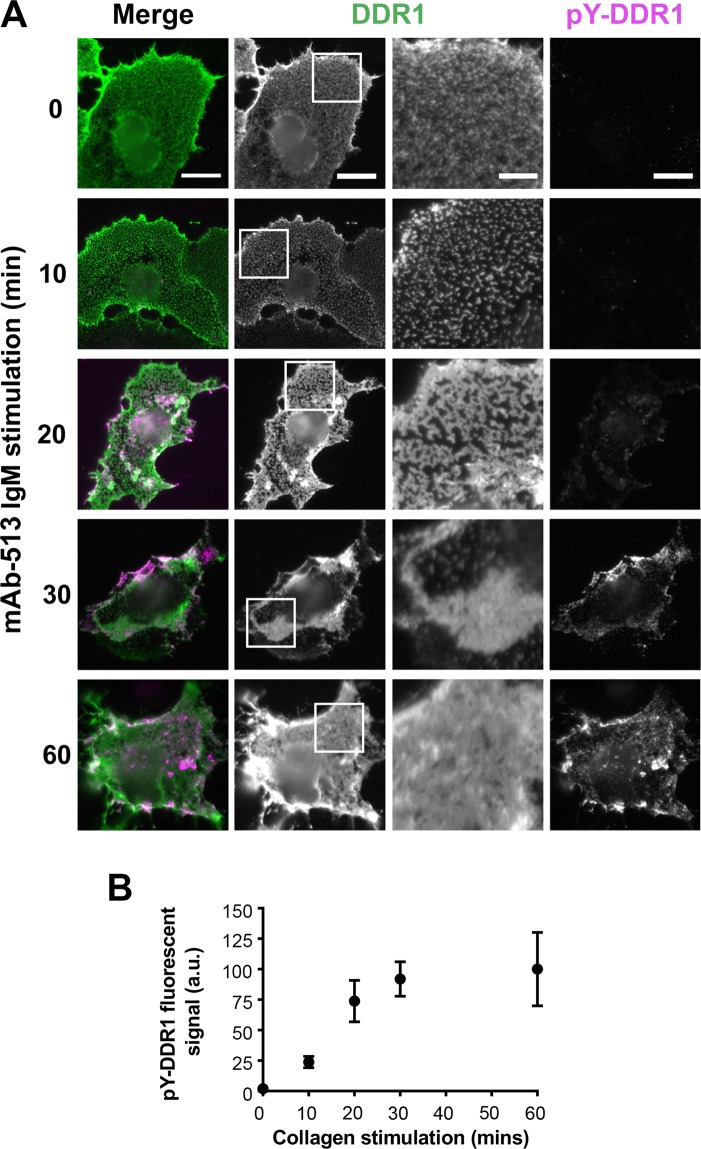
The collagen receptor DDR1 is a receptor tyrosine kinase that promotes progression of a wide range of human disorders. Little is known about how ligand binding triggers DDR1 kinase activity. We previously reported that collagen induces DDR1 activation through lateral dimer association and phosphorylation between dimers, a process that requires specific transmembrane association. Here we demonstrate ligand-induced DDR1 clustering by widefield and super-resolution imaging and provide evidence for a mechanism whereby DDR1 kinase activity is determined by its molecular density. Ligand binding resulted in initial DDR1 reorganisation into morphologically distinct clusters with unphosphorylated DDR1. Further compaction over time led to clusters with highly aggregated and phosphorylated DDR1. Ligand-induced DDR1 clustering was abolished by transmembrane mutations but did not require kinase activity. Our results significantly advance our understanding of the molecular events underpinning ligand-induced DDR1 kinase activity and provide an explanation for the unusually slow DDR1 activation kinetics.


Conflict of interest statement

The authors declare no competing interests.

Figures

Figure 1
Figure 1
Schematic diagram of wild-type and signalling-defective DDR1 mutants. The extracellular region consists of two globular domains, the N-terminal discoidin (DS) domain and the discoidin-like (DS-like) domain, followed by a highly flexible juxtamembrane (JM) region. The transmembrane (TM) region contains a dimerisation motif. The intracellular catalytic kinase domain is preceded by a large unstructured JM region. The collagen-binding trench in the DS domain is shown in red. Collagen binding to this site in wild-type DDR1 induces phosphorylation of cytoplasmic tyrosine residues in both the JM region and kinase domain (shown as yellow circles). None of the mutants are phosphorylated upon collagen incubation. DDR1-W53A has a mutation in the ligand binding pocket in the DS domain. DDR1-R32E and DDR1-L152E are signalling defective mutants with mutations in the ‘signal patch’ region in the base of the DS domain, near the DS-like domain. DDR1-TM1 is a mutant with impaired transmembrane helix association, and DDR1-K655A is a mutant with impaired catalytic function. The locations of mutations are indicated by red stars, and anti-DDR1 epitopes located in the DS-like domain are symbolised by blue and green ovals for wild-type DDR1.
Figure 2
Figure 2
Collagen I induces DDR1 redistribution on the cell surface. COS-7 cells transiently expressing DDR1 were stimulated with collagen as detailed below. (A) Cells were stimulated for the indicated times (in minutes) at 37 °C, then incubated on ice with mAb 7A9 against the DDR1 ectodomain, before fixation and secondary Ab staining. (B) Cells were stimulated for the indicated times at 37 °C. Staining was done as above. The graph shows mean ZC scores + SEM (N = 200–400 regions from 80–100 cells from 3 independent experiments). *p < 0.05; ****p < 0.0001 (one-way ANOVA, followed by Bonferroni post hoc test). Data are from a different set of experiments than those shown in panel A. (C,D) Cells were stimulated for the indicated times at 37 °C, then fixed and permeabilised, and immunostained for phospho-tyrosine 513 (pY-DDR1) and for DDR1. (C) Mean pY-DDR1 levels across three experiments: mean values were normalised within experiments and then mean values taken for each stimulation time. N is at least 30 for each stimulation time. (D) The proportion of cells expressing DDR1 with pY-DDR1 signal above background levels were manually counted for different stimulation times. Mean percentage values ± SEM (N = 55 for all stimulation times, from two independent experiments). (E) Cells were either stimulated with collagen I for 10 minutes at 37 °C or left unstimulated, then incubated on ice with mAb 7A9 against the DDR1 ectodomain (shown in green) and anti-collagen-I mAb (shown in magenta), before fixation, and secondary Ab staining. White boxes in left columns indicate corresponding areas shown at higher magnification in columns to the right. All cells were imaged using a widefield microscope. At least 30 cells were imaged for each condition. Scale bars, 30 μm or 10 μm (enlarged images).
Figure 3
Figure 3
Collagen binding and collagen-induced DDR1 redistribution of signalling defective DDR1 mutants. COS-7 cells transiently expressing WT-DDR1 or the indicated DDR1 mutant were stimulated with collagen I as detailed below. (A) Cells were stimulated with collagen for 10 minutes at 37 °C or left unstimulated, then incubated on ice with mAb 7A9, before fixation and secondary Ab staining. White boxes in left columns indicate corresponding areas shown at higher magnification in right columns. (B) Cells were stimulated with collagen for 60 minutes at 37 °C or left unstimulated, then incubated on ice with mAb 7A9 (shown in green) and anti-collagen I mAb (shown in magenta), before fixation, and secondary Ab staining. Graph shows the quantified anti-collagen signal with the exclusion of collagen not colocalised with DDR1. The mean collagen-immunostain intensity was calculated for each condition then normalised so that WT-DDR1 collagen-unstimulated and stimulated values were 0 and 100 A.U., respectively. Error bars are SEM (N = 65–121 cells from 3 independent experiments). (C) Cells expressing WT-DDR1 were incubated with either collagen I, a mixture of collagen I and anti-DDR1 mAb 7A9, or left unstimulated for 60 minutes at 37 °C. Cells were then immunostained as in B. Arrows indicate collagen aggregates not colocalising with DDR1. Cells were imaged using a widefield microscope. Scale bars, 30 μm or 5 μm (enlarged images in A). For each condition, at least 20 cells were imaged in A, and at least 30 cells were imaged in C.
Figure 4
Figure 4
Signalling-defective DDR1 mutants bind triple-helical DDR1 selective peptide but do not phosphorylate with peptide stimulation. (A) COS-7 cells transiently expressing wild-type DDR1 or the indicated DDR1 mutant were incubated with or without a biotinylated DDR-selective collagen-mimetic peptide for 60 minutes on ice, followed by incubation with anti-DDR1 mAb 7A9 on ice. Cells were then fixed and incubated with Alexa Fluor-488 goat-anti-mouse IgG and Alexa Fluor-546 conjugated streptavidin. Cells were imaged by widefield microscopy. The graph shows mean fluorescence intensity, normalised to respective DDR1 expression levels. N = 27–31 fields of view from 3 independent experiments. Scale bar, 20 μm. (B) HEK293 transiently expressing wild-type DDR1 or the indicated DDR1 mutant were stimulated with collagen I (C), or with DDR-selective collagen-mimetic peptide (P) for 60 minutes at 37 °C or were left unstimulated. Cell lysates were analysed by Western blot using an Ab against phosphorylated Tyr-513 (anti-pY). The blot was stripped and re-probed with anti-DDR1. The positions of molecular mass markers are indicated on the left in kDa. The bar chart shows the densitometry analysis of pY513 band intensities after normalization to total DDR1. Each value is a percentage of the sum of all the pY513/DDR1 signals on the blot. The graph shows mean band intensities + SEM (N = 3). NS, no significance; *p < 0.05; **P < 0.01; ****p < 0.0001 (two-way ANOVA, followed by Tukey’s multiple comparisons test. (C) COS-7 cells transiently expressing DDR1 were incubated with collagen-mimetic triple-helical peptide (Peptide) or a control triple-helical peptide without the DDR binding motif (Control) for 0 to 60 minutes at 37 °C, as indicated. Cells were then incubated with anti-DDR1 mAb7A9 Ab on ice, before fixation and incubation with secondary Abs. Lower panels show magnified views of the boxed areas in the upper panels. Cells were imaged by widefield microscopy. Scale bars, 20 μm (upper image) or 10 μm (magnification). Right: ZC score of surface DDR1 staining in cells stimulated with Control or Peptide for 0 to 60 minutes. Data show mean + SEM (N = 200–300 regions from 35–50 cells from 2 independent experiments). NS, no significance; ***p < 0.001 (one-way ANOVA, followed by Bonferroni post hoc test).
Figure 5
Figure 5
Anti-DDR1 mAbs block phosphorylation of collagen-bound DDR1. The diagram at the top gives an overview of the experimental procedures. HEK293 cells transiently expressing wide-type DDR1 were first incubated with collagen I for 60 minutes on ice, in the presence (+) or absence (−) of the indicated anti-DDR1 mAbs (Phase 1). Following washes, cells were incubated for 30 minutes at 37 °C, in the absence (no mAb) or presence of the indicated mAbs (Phase 2). The sample shown in lane 1 was lysed immediately after the incubation with collagen on ice. Samples labelled 2 were replicate lysates from 3 different wells. Cell lysates were analysed by Western blot using a mAb against phosphorylated Tyr-513 (anti-pY). The blot was stripped and re-probed with rabbit anti-DDR1. The positions of molecular mass markers are indicated on the left in kDa. The bar chart shows the densitometry analysis of pY513 band intensities after normalization to total DDR1. Each value is a percentage of the sum of all the pY513/DDR1 signals on the blot. The graph shows mean band intensities + SEM (N = 3). ****p < 0.0001 (one-way ANOVA, followed by Dunnett's multiple comparison test).
Figure 6
Figure 6
SIM images reveal DDR1-immunostain double-walled structures for cells stimulated with collagen for 60 minutes at 37 °C. COS-7 cells transiently expressing DDR1 were stimulated with collagen I for 10 or 60 minutes at 37 °C or left unstimulated, then incubated on ice with mAb 7A9, before fixation and secondary Ab staining. 3D-SIM images were acquired using a Zeiss ELRYA microscope; images are from one of 15 slices. Lower panels show magnified views of the boxed areas in the upper panels. Arrowheads in A indicate example structures wider than 200 nm (full width at half maximum). Scale bars, 30 μm (upper panels) or 5 μm (magnified images). At least 10 cells were imaged for each condition.
Figure 7
Figure 7
Aggregated and phosphorylated DDR1 is present in the double walled anti-DDR1 structures. (A) COS-7 cells transiently expressing DDR1 were stimulated with collagen I for 60 minutes at 37 °C, then incubated on ice with anti-DDR1 mAb 7A9 and anti-collagen I mAb, before fixation, permeabilisation and immunostaining for phospho-tyrosine 513 (pY-DDR1). Intensity of the three stains was measured across the three lines shown (with a line width of 200 nm), the data were normalised so that the lowest and highest value from each stain was 0 and 100 A.U. (B,C) COS-7 cells transiently expressing DDR1-SNAP were incubated with SNAP-Surface Alexa Fluor-546 for 60 minutes at 37 °C, then stimulated with collagen I for 60 minutes (B) or for 5, 10, or 60 minutes (C) at 37 °C. Cells were then incubated on ice with anti-DDR1 mAb 5D5, before fixation, and secondary Ab staining (B), or fixed and mounted (C). 3D-SIM images were acquired using a Zeiss ELRYA microscope. Images are from a maximum intensity projection of all 15 slices (B) or from a single slice (A,C). White boxes indicate corresponding areas shown at higher magnification in lower images (B). Scale bars, 5 μm (A), 30 μm (upper image in B), 2 μm (enlarged images in B) or 3 μm (C). White arrows indicate examples of anti-DDR1 mAb binding at the edges of aggregated DDR1-SNAP signal (B). At least 10 cells were imaged for each condition.
Figure 8
Figure 8
mAb-513-induced DDR1 redistribution and phosphorylation. (A) COS-7 cells transiently expressing DDR1 were either incubated with mAb-513 IgM for the indicated times at 37 °C or left unstimulated, then incubated on ice with anti-DDR1 mAb 7A9, before fixation, permeabilisation and immunostaining for phospho-tyrosine 513 (pY-DDR1). Cells were imaged using a widefield microscope. White boxes in DDR1 images indicate corresponding areas shown at higher magnification in images to the right. Scale bars, 30 μm or 10 μm (magnification). (B) Cells were treated and imaged as above. Mean pY-DDR1 signal for each cell was calculated and averaged for the stimulation time. Values were normalised so that the mean value for 0 and 60 minutes was 0 and 100 A.U respectively. Error bars are SEM. N = 15–23.

Similar articles

Cited by

References

    1. Lemmon MA, Schlessinger J, Ferguson KM. The EGFR family: not so prototypical receptor tyrosine kinases. Cold Spring Harb. Perspect. Biol. 2014;6:a020768. doi: 10.1101/cshperspect.a020768. - DOI - PMC - PubMed
    1. Tatulian SA. Structural dynamics of insulin receptor and transmembrane signaling. Biochemistry. 2015;54:5523–5532. doi: 10.1021/acs.biochem.5b00805. - DOI - PubMed
    1. Leitinger B. Discoidin domain receptor functions in physiological and pathological conditions. Int. Rev. Cell Mol. Biol. 2014;310:39–87. doi: 10.1016/B978-0-12-800180-6.00002-5. - DOI - PMC - PubMed
    1. Carafoli F, et al. Crystallographic insight into collagen recognition by discoidin domain receptor 2. Structure. 2009;17:1573–1581. doi: 10.1016/j.str.2009.10.012. - DOI - PMC - PubMed
    1. Noordeen NA, Carafoli F, Hohenester E, Horton MA, Leitinger B. A transmembrane leucine zipper is required for activation of the dimeric receptor tyrosine kinase DDR1. J. Biol. Chem. 2006;281:22744–22751. doi: 10.1074/jbc.M603233200. - DOI - PubMed

Publication types