. 2019 Dec;26(12):1123-1131.
doi: 10.1038/s41594-019-0330-y. Epub 2019 Nov 18.

Structure of an endosomal signaling GPCR-G protein-β-arrestin megacomplex

Affiliations

Structure of an endosomal signaling GPCR-G protein-β-arrestin megacomplex

Anthony H Nguyen et al. Nat Struct Mol Biol. 2019 Dec.

Abstract

Classically, G-protein-coupled receptors (GPCRs) are thought to activate G protein from the plasma membrane and are subsequently desensitized by β-arrestin (β-arr). However, some GPCRs continue to signal through G protein from internalized compartments, mediated by a GPCR-G protein-β-arr 'megaplex'. Nevertheless, the molecular architecture of the megaplex remains unknown. Here, we present its cryo-electron microscopy structure, which shows simultaneous engagement of human G protein and bovine β-arr to the core and phosphorylated tail, respectively, of a single active human chimeric β2-adrenergic receptor with the C-terminal tail of the arginine vasopressin type 2 receptor (β2V2R). All three components adopt their canonical active conformations, suggesting that a single megaplex GPCR is capable of simultaneously activating G protein and β-arr. Our findings provide a structural basis for GPCR-mediated sustained internalized G protein signaling.


Conflict of interest statement

Competing Interests Statement

The authors declare no competing interests.

Figures
Extended Data Fig. 1:
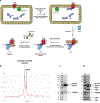
Extended Data Fig. 1:. Sample preparation and purification of the megaplex.
a, Schematic illustration of the purification and in vitro formation procedure of the megaplex. b, Size exclusion chromatogram of the precursor β2V2R–βarr1–Fab30 complex. c, SDS-PAGE gel of the β2V2R–βarr1–Fab30 complex after purification by size exclusion chromatography. d, SDS-PAGE gel of the megaplex after in vitro formation and M1 anti-Flag purification. For c-d, M denotes molecular weight (kDa) marker. Uncropped gel images for Extended Data Fig. 1c,d are provided as Source Data.
Extended Data Fig. 2:
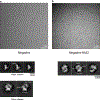
Extended Data Fig. 2:. Nanobody 32 (Nb32) stabilizes the megaplex.
a, Representative micrograph and 2D class averages of megaplex samples prepared without nanobody 32 (Nb32), displaying a small percentage of megaplexes. b, Same as in a, but with a megaplex sample prepared with Nb32.
Extended Data Fig. 3:
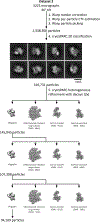
Extended Data Fig. 3:. A procedure utilizing Warp and cryoSPARC for initial data processing and cleaning of one representative dataset (Dataset 2).
The same procedure was used on all dataset.
Extended Data Fig. 4:
Data processing workflow for all datasets of the megaplex.
Extended Data Fig. 5:
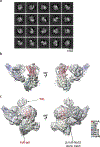
Extended Data Fig. 5:. Megaplex consensus reconstruction.
a, Representative 2D class averages of the consensus megaplex reconstruction. b-c, The megaplex reconstruction is shown at high (0.115) threshold (b), and low (0.05) threshold (c). The T4L and flexible portion of the V2T appears at a lower threshold. The atomic models of the components, derived from signal subtracted reconstructions, are fitted to the consensus reconstruction. Densities for the flexible V2T and steric clash between the β2V2R and Nb32 are denoted by black circles.
Extended Data Fig. 6:
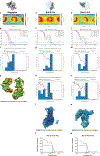
Extended Data Fig. 6:. Orientational distribution and resolution measurements of the megaplex.
a-d, orientational distribution (a), FSC curves indicating overall resolution (FSC = 0.143) (b), 3D-FSC to assess directional resolution anisotropy (c), and local resolution measurements (d) of the megaplex consensus reconstruction. e-j, orientational distribution (e), FSC curves indicating overall resolution (FSC = 0.143) (f), 3D-FSC to assess directional resolution anisotropy (g), map-to-model FSC and sphericity (h), local resolution measurements (i), and map-to-model FSC curve (j) of the β2V2R–Gs reconstruction. k-p, same as e-j, but for the βarr1–V2T reconstruction.
Extended Data Fig. 7:
Extended Data Fig. 7:. Representative densities in black mesh of various protein components.
Representative densities, from the 3.8Å β2V2R–Gs and 4.0Å βarr1–V2T structures, of the β2V2R, Gs subunits, and βarr1.
Extended Data Fig. 8:
Extended Data Fig. 8:. Representative density of the β2V2R–Gs portion of the megaplex, and comparison against other active β2AR structures.
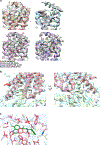
a, Comparison of the binding pose of BI-167107 (BI) in the megaplex against three other available BI-bound β2AR structures. BI is colored green. b, Representative density showing contacts between the β2V2R and Gs in the megaplex. c, The BI binding pocket within the megaplex, accompanied by EM density for all residues within 5 Å of the ligand.
Extended Data Fig. 9:
Extended Data Fig. 9:. Interaction between Fab30, V2T and protein stabilizers.
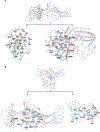
a-b, Interface between βarr1 and V2T with either Nb32 (a) or Fab30 (b). Interface residues are labeled.
Extended Data Fig. 10:
Extended Data Fig. 10:. Verification of observed phosphorylation sites on the V2T.
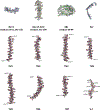
a, Cryo-EM density for the six phosphorylated residues on the V2T. b, Localization probabilities of eight potential sites of phosphorylation on the V2T assessed by LC-MS/MS. A trypsin-digested fragment of the V2T is displayed. Bolded residues are phosphorylation sites observed in the cryo-EM map. Residues in red were not observed in the map, and yellow-highlighted residues were phosphorylated in both unstimulated and BI-stimulated receptors.
Fig. 1.
Fig. 1.. Schematic illustration of the mechanism of sustained signaling through the formation of endosomal class B GPCR–G protein–βarr megacomplexes.
Binding of β-arrestin (βarr) to a GRK-phosphorylated GPCR tail (leaving the receptor intracellular core open) and subsequent receptor internalization allows for further G protein binding, forming a megaplex (black box). The megaplex continues to activate G protein, leading to sustained endosomal cAMP generation.
Fig. 2.
Fig. 2.. Cryo-EM structure of a β2V2R–Gs–βarr1 megaplex.
a, Composite cryo-EM density map of the megaplex reconstruction fitted into a transparent envelope of the megaplex consensus structure. b, Same as in a, but with protein stabilizers (Nb35, Nb32, and Fab30) and consensus reconstruction removed. Red dashed lines indicate the flexible C-terminal tail connecting βarr1 to the receptor.
Fig. 3.
Fig. 3.. Structure and interactions of the β2V2R–Gs portion of the megaplex
a, Orthogonal views of the density map and model for the β2V2R–Gs portion of the megaplex. Small top image orients the β2V2R–Gs subcomplex in relation to the megaplex consensus structure. b, Intracellular view of the superimposition between the megaplex β2V2R and the inactive, carazolol-bound β2AR (PDB: 2RH1). Blue arrows indicate movements in transmembrane helices (TMs) 3,5,6 and 7 and their magnitudes. c, Intracellular view of the superimposition between the megaplex β2V2R and the Gs-bound β2AR (PDB: 3SN6). d, Ligand-binding pocket of the β2V2R, with density for the agonist BI-167107 (BI-167107, green) in mesh. e, Interaction of the α5-helix of Gαs with hydrophobic residues on TM5 and TM6, and with polar residues between TM3 and TM5 of the β2V2R. β2V2R residues are labeled in black for d and e. f, Structural comparison of the β2AR–Gs complex (pink, PDB: 3SN6) against the β2V2R–Gs portion of the megaplex, both aligned by their receptors. Curved arrows indicate 3° rotation of Gαs around an axis parallel to the β2V2R-α5 helix contact and 3.4° rotation of Gβγ around an axis parallel to the plasma membrane seen in the megaplex.
Fig. 4.
Fig. 4.. Structure and interactions of the βarr1–V2T portion of the megaplex.
a, Density map and model for the megaplex βarr1–V2T. Mesh delineates density for the V2T. Small top image orients the βarr1–V2T subcomplex in relation to the megaplex consensus structure. b,c, Regions of the V2T with phosphorylated residues pS357, pT359, pT360 (b) and pS362, pS363, and pS364 (c) interacting with positively charged residues on βarr1, which are colored in green and labeled in blue.
Fig. 5.
Fig. 5.. Comparison of the megaplex βarr1–V2T to the V2Rpp–βarr1–Fab30 and rhodopsin–visual arrestin crystal structures.
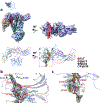
a, Superimposition between the βarr1–V2T (megaplex) and the V2Rpp–βarr1–Fab30 crystal structure. Inset shows interaction between pT347 and pS350 of the V2Rpp with residues near the finger loop region of βarr1. Red and yellow arrows delineate the differing path of the V2T and V2Rpp, respectively. b, Alignment between βarr1–V2T (megaplex) and the rhodopsin–visual arrestin crystal structure. For clarity, only βarr1 of the megaplex is shown in a and b.
Figure 6.
Figure 6.. The megaplex within a membrane environment.
a, Orthogonal views of three modeled megaplex structures for molecular dynamics (MD) simulations with differing βarr1–V2T positions, aligned by their β2V2R–Gs region. b, Coarse-grained MD models of the three structures, aligned by their β2V2R–Gs region at 10 ns increments. Black circles denote transient contact between βarr1 residues and the lipid bilayer. c, Real-time cAMP measurement of BI-stimulated β2V2R or β2V2R–βarr1/2 in β2AR/βarr1/βarr2 triple knock-out HEK293 cells, expressed as percentages of 10 μM Forskolin control. Data represents mean ± S.E.M. of four independent experiments for the β2V2R–βarr1 and β2V2R–βarr2 conditions and of three independent experiments for the β2V2R condition. Ordinary one-way ANOVA with Holm-Sidak’s multiple comparison post-hoc test was performed to determine statistical significance between mock control and the β2V2R or β2V2R–βarr1/2 conditions (****P < 0.0001).

Similar articles

Cited by

References

    1. Reiter E, Ahn S, Shukla AK & Lefkowitz RJ Molecular mechanism of beta-arrestin-biased agonism at seven-transmembrane receptors. Annu Rev Pharmacol Toxicol 52, 179–97 (2012). - PMC - PubMed
    1. Lefkowitz RJ, Stadel JM & Caron MG Adenylate cyclase-coupled beta-adrenergic receptors: structure and mechanisms of activation and desensitization. Annu Rev Biochem 52, 159–86 (1983). - PubMed
    1. Rajagopal S, Rajagopal K & Lefkowitz RJ Teaching old receptors new tricks: biasing seven-transmembrane receptors. Nat Rev Drug Discov 9, 373–86 (2010). - PMC - PubMed
    1. Oakley RH, Laporte SA, Holt JA, Barak LS & Caron MG Association of beta-arrestin with G protein-coupled receptors during clathrin-mediated endocytosis dictates the profile of receptor resensitization. Journal of Biological Chemistry 274, 32248–32257 (1999). - PubMed
    1. Oakley RH, Laporte SA, Holt JA, Caron MG & Barak LS Differential affinities of visual arrestin, beta arrestin1, and beta arrestin2 for G protein-coupled receptors delineate two major classes of receptors. J Biol Chem 275, 17201–10 (2000). - PubMed

Methods-only References

    1. Noble AJ et al. Routine single particle CryoEM sample and grid characterization by tomography. Elife 7(2018). - PMC - PubMed
    1. Mastronarde DN Automated electron microscope tomography using robust prediction of specimen movements. J Struct Biol 152, 36–51 (2005). - PubMed
    1. Tan YZ et al. Addressing preferred specimen orientation in single-particle cryo-EM through tilting. Nat Methods 14, 793–796 (2017). - PMC - PubMed
    1. Suloway C et al. Automated molecular microscopy: the new Leginon system. J Struct Biol 151, 41–60 (2005). - PubMed
    1. Tegunov D & Cramer P Real-time cryo-EM data pre-processing with Warp. BioRxiv (2018).

Publication types

MeSH terms