

Association of longitudinal risk profile trajectory clusters with adipose tissue depots measured by magnetic resonance imaging
- PMID: 31740739
- PMCID: PMC6861315
- DOI: 10.1038/s41598-019-53546-y
Association of longitudinal risk profile trajectory clusters with adipose tissue depots measured by magnetic resonance imaging
Abstract
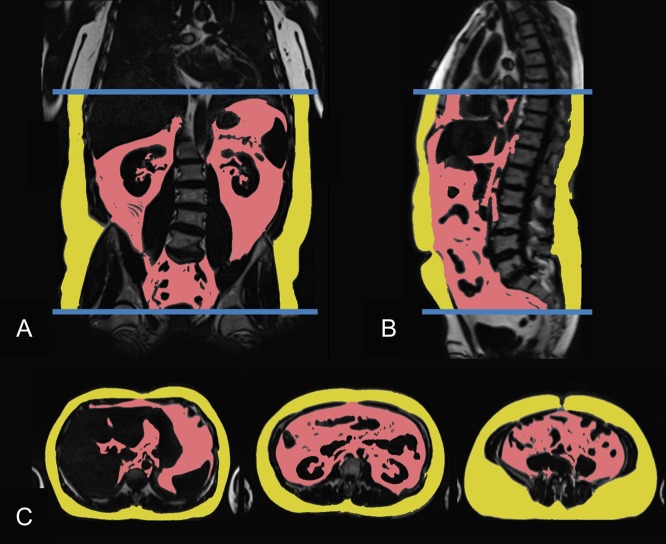
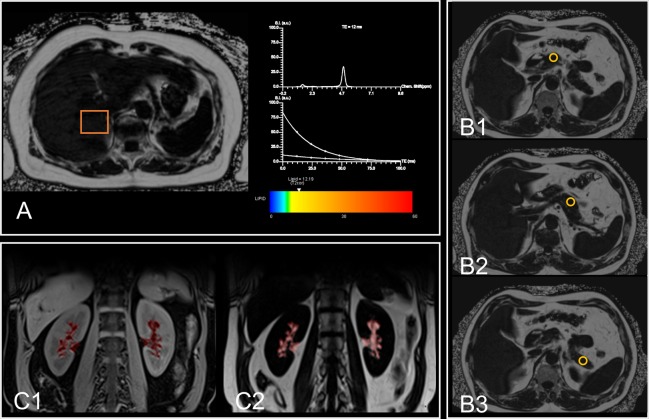
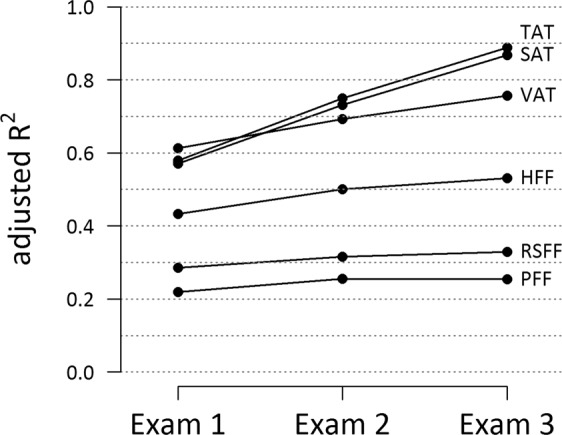
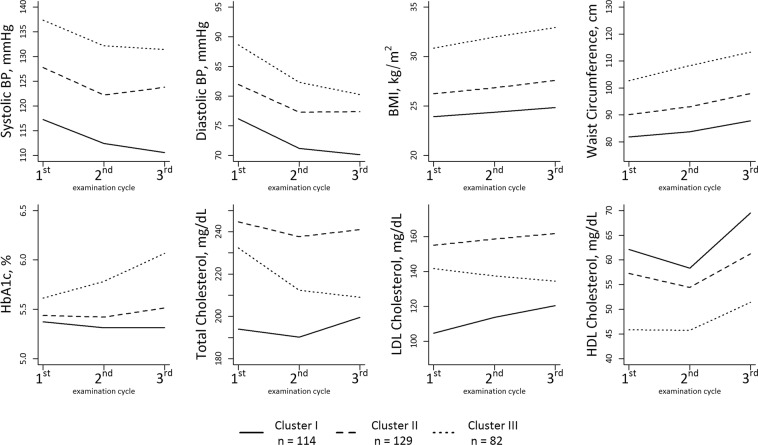
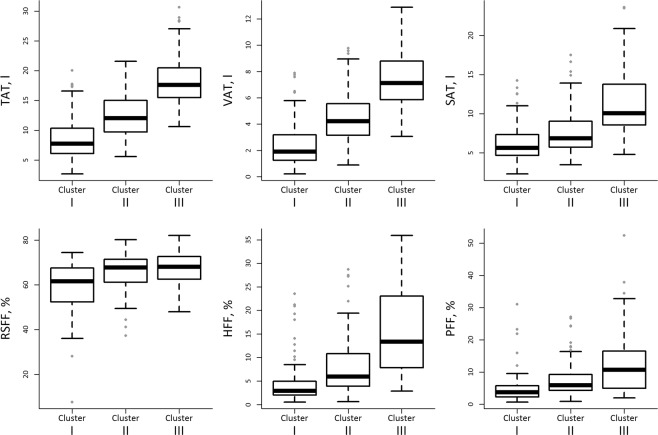
The objective of the study was to identify associations of longitudinal trajectories of traditional cardiometabolic risk factors with abdominal and ectopic adipose tissue depots measured by magnetic resonance imaging (MRI). We measured total abdominal, visceral, and subcutaneous adipose tissue in liter and intrahepatic, intrapancreatic and renal sinus fat as fat fractions by MRI in 325 individuals free of cardiovascular disease at Exam 3 of a population-based cohort. We related these MRI measurements at Exam 3 to longitudinal risk profile trajectory clusters, based on risk factor measurements from Exam 3, Exam 2 (seven years prior to MRI) and Exam 1 (14 years prior to MRI). Based on the levels and longitudinal trajectories of several risk factors (blood pressure, lipid profile, anthropometric measurements, HbA1c), we identified three different trajectory clusters. These clusters displayed a graded association with all adipose tissue traits after adjustment for potential confounders (e.g. visceral adipose tissue: βClusterII = 1.30 l, 95%-CI:[0.84 l;1.75 l], βClusterIII = 3.32 l[2.74 l;3.90 l]; intrahepatic: EstimateClusterII = 1.54[1.27,1.86], EstimateClusterIII = 2.48[1.93,3.16]. Associations remained statistically significant after additional adjustment for the risk factor levels at Exam 1 or Exam 3, respectively. Trajectory clusters provided additional information in explaining variation in the different fat compartments beyond risk factor profiles obtained at individual exams. In conclusion, sustained high risk factor levels and unfavorable trajectories are associated with high levels of adipose tissue; however, the association with cardiometabolic risk factors varies substantially between different ectopic adipose tissues. Trajectory clusters, covering longitudinal risk profiles, provide additional information beyond single-point risk profiles. This emphasizes the need to incorporate longitudinal information in cardiometabolic risk estimation.
Conflict of interest statement
The authors declare no competing interests.
Figures
Similar articles
-
Visceral and Intrahepatic Fat Are Associated with Cardiometabolic Risk Factors Above Other Ectopic Fat Depots: The Framingham Heart Study.Am J Med. 2018 Jun;131(6):684-692.e12. doi: 10.1016/j.amjmed.2018.02.002. Epub 2018 Mar 5. Am J Med. 2018. PMID: 29518370 Free PMC article.
-
Association of antecedent cardiovascular risk factor levels and trajectories with cardiovascular magnetic resonance-derived cardiac function and structure.J Cardiovasc Magn Reson. 2021 Jan 4;23(1):2. doi: 10.1186/s12968-020-00698-w. J Cardiovasc Magn Reson. 2021. PMID: 33390171 Free PMC article.
-
Clusters of longitudinal risk profile trajectories are associated with cardiometabolic diseases: Results from the population-based KORA cohort.PLoS One. 2024 Mar 28;19(3):e0300966. doi: 10.1371/journal.pone.0300966. eCollection 2024. PLoS One. 2024. PMID: 38547172 Free PMC article.
-
Ectopic fat and cardiometabolic and vascular risk.Int J Cardiol. 2013 Nov 5;169(3):166-76. doi: 10.1016/j.ijcard.2013.08.077. Epub 2013 Sep 7. Int J Cardiol. 2013. PMID: 24063931 Review.
-
Imaging of visceral adipose tissue: an emerging diagnostic tool and therapeutic target.Curr Drug Targets Cardiovasc Haematol Disord. 2005 Aug;5(4):345-53. doi: 10.2174/1568006054553408. Curr Drug Targets Cardiovasc Haematol Disord. 2005. PMID: 16101567 Review.
Cited by
-
Parental obesity-induced changes in developmental programming.Front Cell Dev Biol. 2022 Oct 7;10:918080. doi: 10.3389/fcell.2022.918080. eCollection 2022. Front Cell Dev Biol. 2022. PMID: 36274855 Free PMC article. Review.
-
Association between Adipose Tissue Depots and Dyslipidemia: The KORA-MRI Population-Based Study.Nutrients. 2022 Feb 14;14(4):797. doi: 10.3390/nu14040797. Nutrients. 2022. PMID: 35215449 Free PMC article.
-
Precision MRI phenotyping enables detection of small changes in body composition for longitudinal cohorts.Sci Rep. 2022 Mar 8;12(1):3748. doi: 10.1038/s41598-022-07556-y. Sci Rep. 2022. PMID: 35260612 Free PMC article.
-
Evolution of Cardiovascular Risk Factors in a Worker Cohort: A Cluster Analysis.Int J Environ Res Public Health. 2021 May 24;18(11):5610. doi: 10.3390/ijerph18115610. Int J Environ Res Public Health. 2021. PMID: 34074004 Free PMC article.
-
Noninvasive, longitudinal imaging-based analysis of body adipose tissue and water composition in a melanoma mouse model and in immune checkpoint inhibitor-treated metastatic melanoma patients.Cancer Immunol Immunother. 2021 May;70(5):1263-1275. doi: 10.1007/s00262-020-02765-8. Epub 2020 Nov 1. Cancer Immunol Immunother. 2021. PMID: 33130917 Free PMC article.
References
-
- Dale CE, et al. Causal Associations of Adiposity and Body Fat Distribution With Coronary Heart Disease, Stroke Subtypes, and Type 2 Diabetes Mellitus. Clinical Perspective: A Mendelian Randomization Analysis. Circulation. 2017;135:2373–2388. doi: 10.1161/circulationaha.116.026560. - DOI - PMC - PubMed
Publication types
MeSH terms
LinkOut - more resources
Full Text Sources
