

Preclinical Development and Assessment of Viral Vectors Expressing a Fusion Antigen of Plasmodium falciparum LSA1 and LSAP2 for Efficacy against Liver-Stage Malaria
- PMID: 31740525
- PMCID: PMC6977128
- DOI: 10.1128/IAI.00573-19
Preclinical Development and Assessment of Viral Vectors Expressing a Fusion Antigen of Plasmodium falciparum LSA1 and LSAP2 for Efficacy against Liver-Stage Malaria
Abstract
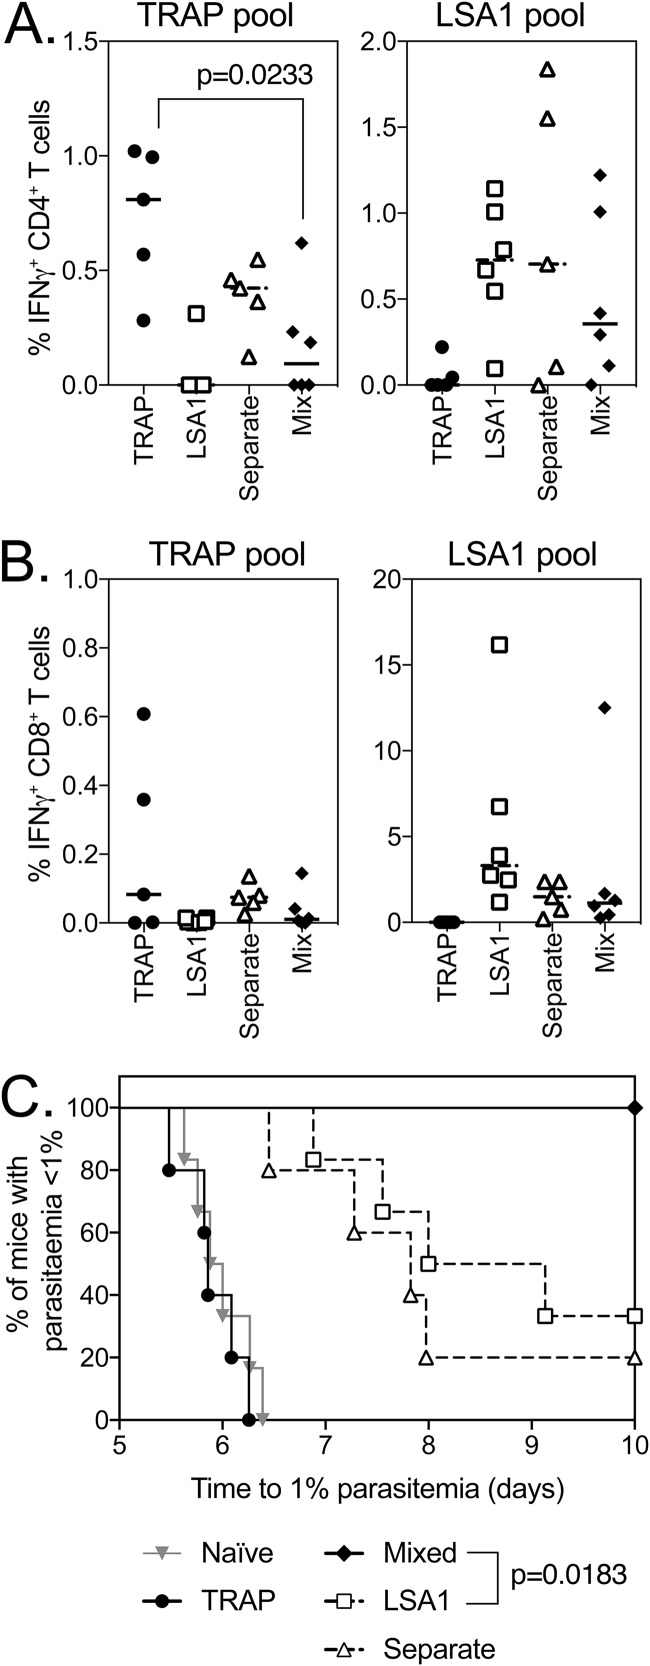
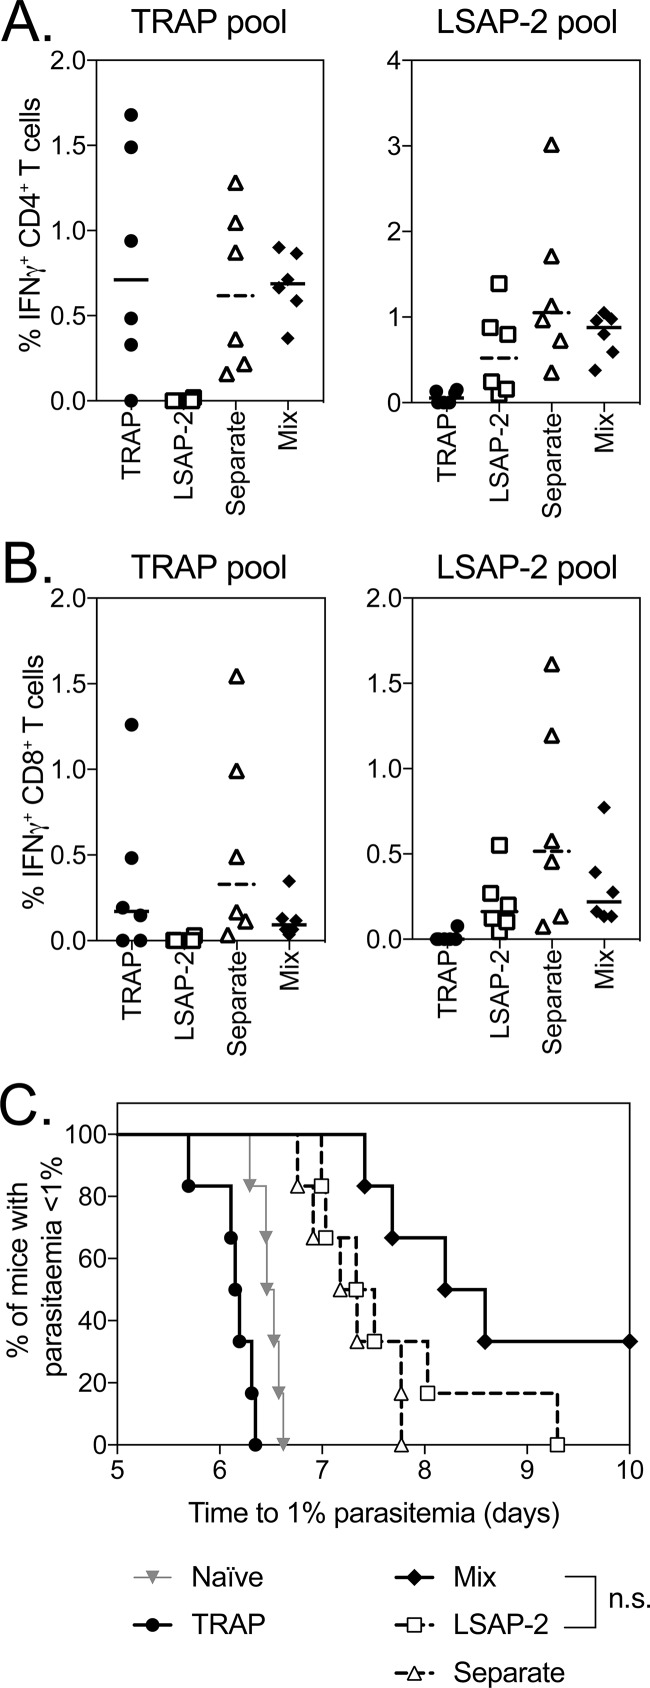
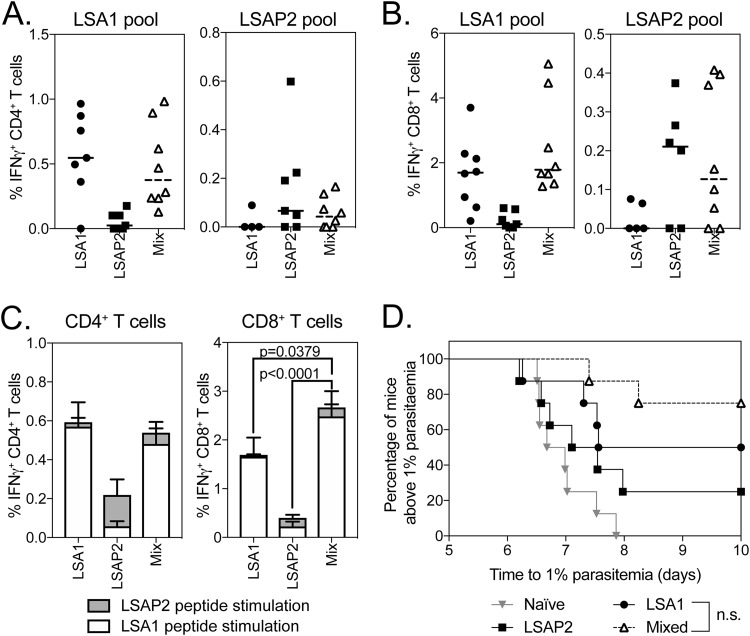
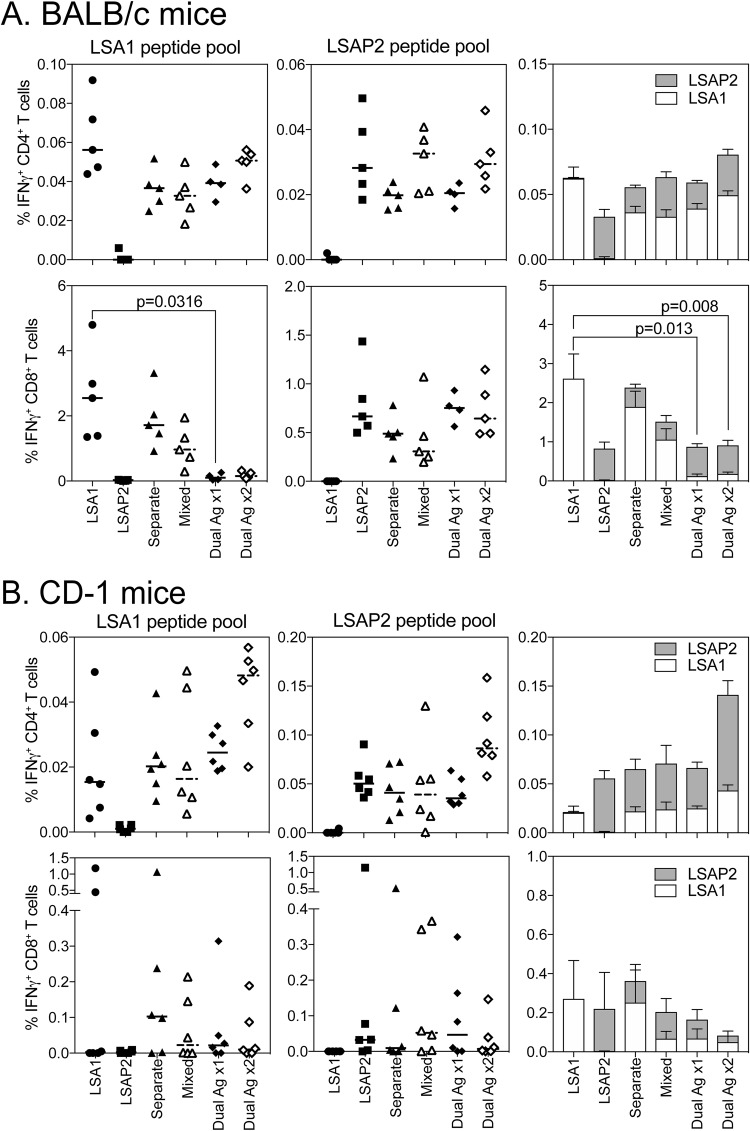
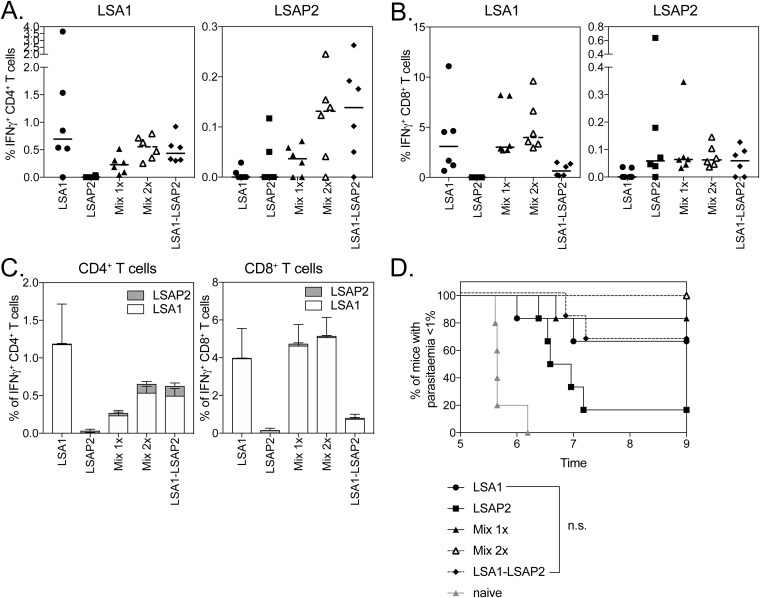
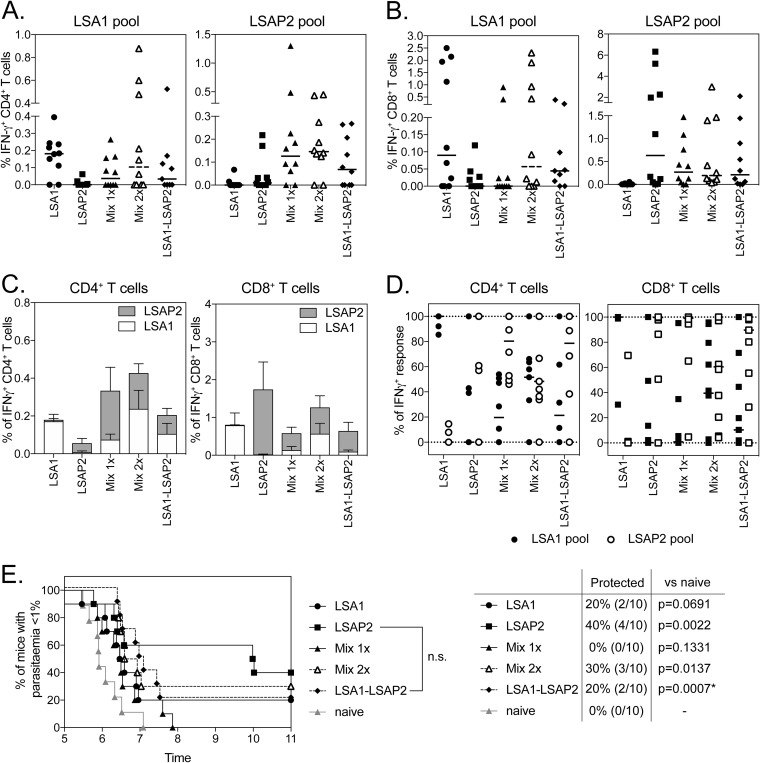
Despite promising progress in malaria vaccine development in recent years, an efficacious subunit vaccine against Plasmodium falciparum remains to be licensed and deployed. Cell-mediated protection from liver-stage malaria relies on a sufficient number of antigen-specific T cells reaching the liver during the time that parasites are present. A single vaccine expressing two antigens could potentially increase both the size and breadth of the antigen-specific response while halving vaccine production costs. In this study, we investigated combining two liver-stage antigens, P. falciparum LSA1 (PfLSA1) and PfLSAP2, and investigated the induction of protective efficacy by coadministration of single-antigen vectors or vaccination with dual-antigen vectors, using simian adenovirus and modified vaccinia virus Ankara vectors. The efficacy of these vaccines was assessed in mouse malaria challenge models using chimeric P. berghei parasites expressing the relevant P. falciparum antigens and challenging mice at the peak of the T cell response. Vaccination with a combination of the single-antigen vectors expressing PfLSA1 or PfLSAP2 was shown to improve protective efficacy compared to vaccination with each single-antigen vector alone. Vaccination with dual-antigen vectors expressing both PfLSA1 and PfLSAP2 resulted in responses to both antigens, particularly in outbred mice, and most importantly, the efficacy was equivalent to that of vaccination with a mixture of single-antigen vectors. Based on these promising data, dual-antigen vectors expressing PfLSA1 and PfLSAP2 will now proceed to manufacturing and clinical assessment under good manufacturing practice (GMP) guidelines.
Keywords: T cells; liver stage; malaria; vaccines.
Copyright © 2020 Halbroth et al.
Figures
Similar articles
-
Recombinant viral-vectored vaccines expressing Plasmodium chabaudi AS apical membrane antigen 1: mechanisms of vaccine-induced blood-stage protection.J Immunol. 2012 May 15;188(10):5041-53. doi: 10.4049/jimmunol.1101106. Epub 2012 Apr 13. J Immunol. 2012. PMID: 22504652 Free PMC article.
-
Immunogenicity of a chimeric Plasmodium falciparum merozoite surface protein vaccine in Aotus monkeys.Malar J. 2016 Mar 15;15:159. doi: 10.1186/s12936-016-1226-5. Malar J. 2016. PMID: 26975721 Free PMC article.
-
Prime-boost vectored malaria vaccines: progress and prospects.Hum Vaccin. 2010 Jan;6(1):78-83. doi: 10.4161/hv.6.1.10116. Epub 2010 Jan 18. Hum Vaccin. 2010. PMID: 20061802 Review.
-
Evaluation of Plasmodium vivax Cell-Traversal Protein for Ookinetes and Sporozoites as a Preerythrocytic P. vivax Vaccine.Clin Vaccine Immunol. 2017 Apr 5;24(4):e00501-16. doi: 10.1128/CVI.00501-16. Print 2017 Apr. Clin Vaccine Immunol. 2017. PMID: 28179403 Free PMC article.
-
Progress with viral vectored malaria vaccines: A multi-stage approach involving "unnatural immunity".Vaccine. 2015 Dec 22;33(52):7444-51. doi: 10.1016/j.vaccine.2015.09.094. Epub 2015 Oct 21. Vaccine. 2015. PMID: 26476366 Free PMC article. Review.
Cited by
-
Recent Advances in the Development of Adenovirus-Vectored Vaccines for Parasitic Infections.Pharmaceuticals (Basel). 2023 Feb 22;16(3):334. doi: 10.3390/ph16030334. Pharmaceuticals (Basel). 2023. PMID: 36986434 Free PMC article. Review.
-
A Novel Vaccine Strategy to Prevent Cytauxzoonosis in Domestic Cats.Vaccines (Basel). 2023 Mar 2;11(3):573. doi: 10.3390/vaccines11030573. Vaccines (Basel). 2023. PMID: 36992157 Free PMC article.
-
Screening of viral-vectored P. falciparum pre-erythrocytic candidate vaccine antigens using chimeric rodent parasites.PLoS One. 2021 Jul 12;16(7):e0254498. doi: 10.1371/journal.pone.0254498. eCollection 2021. PLoS One. 2021. PMID: 34252120 Free PMC article.
-
An In Silico Analysis of Malaria Pre-Erythrocytic-Stage Antigens Interpreting Worldwide Genetic Data to Suggest Vaccine Candidate Variants and Epitopes.Microorganisms. 2022 May 25;10(6):1090. doi: 10.3390/microorganisms10061090. Microorganisms. 2022. PMID: 35744609 Free PMC article.
-
Pre-Erythrocytic Vaccines against Malaria.Vaccines (Basel). 2020 Jul 21;8(3):400. doi: 10.3390/vaccines8030400. Vaccines (Basel). 2020. PMID: 32708179 Free PMC article. Review.
References
-
- WHO. 2015. World Malaria Report 2015. WHO, Geneva, Switzerland.
-
- RTS,S Clinical Trials Partnership. 2015. Efficacy, and safety of RTS,S/AS01 malaria vaccine with or without a booster dose in infants and children in Africa: final results of a phase 3, individually randomised, controlled trial. Lancet 386:31–45. doi:10.1016/S0140-6736(15)60721-8. - DOI - PMC - PubMed
-
- Ewer KJ, O'Hara GA, Duncan CJA, Collins KA, Sheehy SH, Reyes-Sandoval A, Goodman AL, Edwards NJ, Elias SC, Halstead FD, Longley RJ, Rowland R, Poulton ID, Draper SJ, Blagborough AM, Berrie E, Moyle S, Williams N, Siani L, Folgori A, Colloca S, Sinden RE, Lawrie AM, Cortese R, Gilbert SC, Nicosia A, Hill AVS. 2013. Protective CD8+ T-cell immunity to human malaria induced by chimpanzee adenovirus-MVA immunisation. Nat Commun 4:2836. doi:10.1038/ncomms3836. - DOI - PMC - PubMed
-
- Ogwang C, Kimani D, Edwards NJ, Roberts R, Mwacharo J, Bowyer G, Bliss C, Hodgson SH, Njuguna P, Viebig NK, Nicosia A, Gitau E, Douglas S, Illingworth J, Marsh K, Lawrie A, Imoukhuede EB, Ewer K, Urban BC, Hill AVS, Bejon P, MVVC Group . 2015. Prime-boost vaccination with chimpanzee adenovirus and modified vaccinia Ankara encoding TRAP provides partial protection against Plasmodium falciparum infection in Kenyan adults. Sci Transl Med 7:286re285. doi:10.1126/scitranslmed.aaa2373. - DOI - PMC - PubMed
-
- Chuang I, Sedegah M, Cicatelli S, Spring M, Polhemus M, Tamminga C, Patterson N, Guerrero M, Bennett JW, McGrath S, Ganeshan H, Belmonte M, Farooq F, Abot E, Banania JG, Huang J, Newcomer R, Rein L, Litilit D, Richie NO, Wood C, Murphy J, Sauerwein R, Hermsen CC, McCoy AJ, Kamau E, Cummings J, Komisar J, Sutamihardja A, Shi M, Epstein JE, Maiolatesi S, Tosh D, Limbach K, Angov E, Bergmann-Leitner E, Bruder JT, Doolan DL, King CR, Carucci D, Dutta S, Soisson L, Diggs C, Hollingdale MR, Ockenhouse CF, Richie TL. 2013. DNA prime/adenovirus boost malaria vaccine encoding P falciparum CSP and AMA1 induces sterile protection associated with cell-mediated immunity. PLoS One 8:e55571. doi:10.1371/journal.pone.0055571. - DOI - PMC - PubMed
Publication types
MeSH terms
Substances
Grants and funding
LinkOut - more resources
Full Text Sources
Medical
