Time-lapse image analysis for whole colony growth curves and daily distribution of the cell number per colony during the expansion of mesenchymal stem cells
- PMID: 31728017
- PMCID: PMC6856116
- DOI: 10.1038/s41598-019-53383-z
Time-lapse image analysis for whole colony growth curves and daily distribution of the cell number per colony during the expansion of mesenchymal stem cells
Abstract
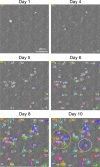
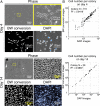
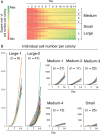
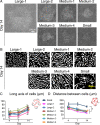
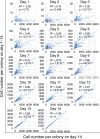
Mesenchymal stem cells from the synovium (synovial MSCs) are attractive for cartilage and meniscus regeneration therapy. We developed a software program that can distinguish individual colonies and automatically count the cell number per colony using time-lapse images. In this study, we investigated the usefulness of the software and analyzed colony formation in cultured synovial MSCs. Time-lapse image data were obtained for 14-day-expanded human synovial MSCs. The cell number per colony (for 145 colonies) was automatically counted from phase-contrast and nuclear-stained images. Colony growth curves from day 1 to day 14 (for 140 colonies) were classified using cluster analysis. Correlation analysis of the distribution of the cell number per colony at 14 days versus that number at 1-14 days revealed a correlation at 7 and 14 days. We obtained accurate cell number counts from phase-contrast images. Individual colony growth curves were classified into three main groups and subgroups. Our image analysis software has the potential to improve the evaluation of cell proliferation and to facilitate successful clinical applications using MSCs.
Conflict of interest statement
The authors declare no competing interests.
Figures

Similar articles
-
Mesenchymal Stem Cells in Synovial Fluid Increase in Knees with Degenerative Meniscus Injury after Arthroscopic Procedures through the Endogenous Effects of CGRP and HGF.Stem Cell Rev Rep. 2020 Dec;16(6):1305-1315. doi: 10.1007/s12015-020-10047-0. Epub 2020 Sep 30. Stem Cell Rev Rep. 2020. PMID: 32996054
-
A Novel Arthroscopic Technique for Intraoperative Mobilization of Synovial Mesenchymal Stem Cells.Am J Sports Med. 2018 Dec;46(14):3532-3540. doi: 10.1177/0363546518803757. Epub 2018 Nov 12. Am J Sports Med. 2018. PMID: 30419170 Free PMC article.
-
Chondrogenic differentiation of synovial fluid mesenchymal stem cells on human meniscus-derived decellularized matrix requires exogenous growth factors.Acta Biomater. 2018 Oct 15;80:131-143. doi: 10.1016/j.actbio.2018.09.038. Epub 2018 Sep 26. Acta Biomater. 2018. PMID: 30267878
-
Mesenchymal Stem/Progenitor Cells Derived from Articular Cartilage, Synovial Membrane and Synovial Fluid for Cartilage Regeneration: Current Status and Future Perspectives.Stem Cell Rev Rep. 2017 Oct;13(5):575-586. doi: 10.1007/s12015-017-9753-1. Stem Cell Rev Rep. 2017. PMID: 28721683 Review.
-
Synovial fluid and synovial membrane mesenchymal stem cells: latest discoveries and therapeutic perspectives.Stem Cell Res Ther. 2014 Oct 3;5(5):112. doi: 10.1186/scrt501. Stem Cell Res Ther. 2014. PMID: 25688673 Free PMC article. Review.
Cited by
-
Safety of using cultured cells with trisomy 7 in cell therapy for treating osteoarthritis.Regen Ther. 2022 Jun 17;21:81-86. doi: 10.1016/j.reth.2022.06.003. eCollection 2022 Dec. Regen Ther. 2022. PMID: 35785042 Free PMC article. Review.
-
Arp2/3 mediated dynamic lamellipodia of the hPSC colony edges promote liposome-based DNA delivery.Stem Cells. 2024 Jul 8;42(7):607-622. doi: 10.1093/stmcls/sxae033. Stem Cells. 2024. PMID: 38717908
-
Cell membrane fluidity and ROS resistance define DMSO tolerance of cryopreserved synovial MSCs and HUVECs.Stem Cell Res Ther. 2022 May 3;13(1):177. doi: 10.1186/s13287-022-02850-y. Stem Cell Res Ther. 2022. PMID: 35505370 Free PMC article.
-
Optimizing the Seeding Density of Human Mononuclear Cells to Improve the Purity of Highly Proliferative Mesenchymal Stem Cells.Bioengineering (Basel). 2023 Jan 11;10(1):102. doi: 10.3390/bioengineering10010102. Bioengineering (Basel). 2023. PMID: 36671674 Free PMC article.
-
Optimal Pore Size of Honeycomb Polylactic Acid Films for In Vitro Cartilage Formation by Synovial Mesenchymal Stem Cells.Stem Cells Int. 2021 Aug 2;2021:9239728. doi: 10.1155/2021/9239728. eCollection 2021. Stem Cells Int. 2021. PMID: 34394358 Free PMC article.
References
Publication types
MeSH terms
LinkOut - more resources
Full Text Sources

