

A human expression system based on HEK293 for the stable production of recombinant erythropoietin
- PMID: 31727983
- PMCID: PMC6856173
- DOI: 10.1038/s41598-019-53391-z
A human expression system based on HEK293 for the stable production of recombinant erythropoietin
Abstract
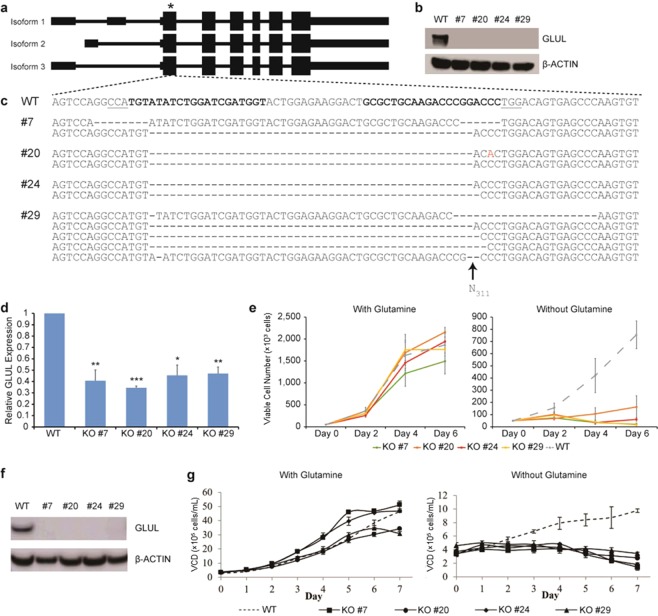
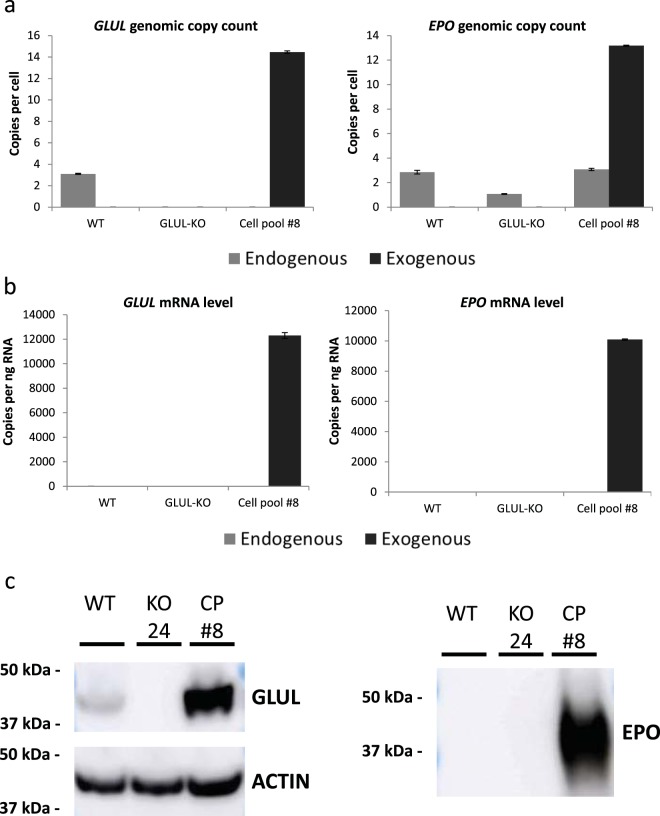
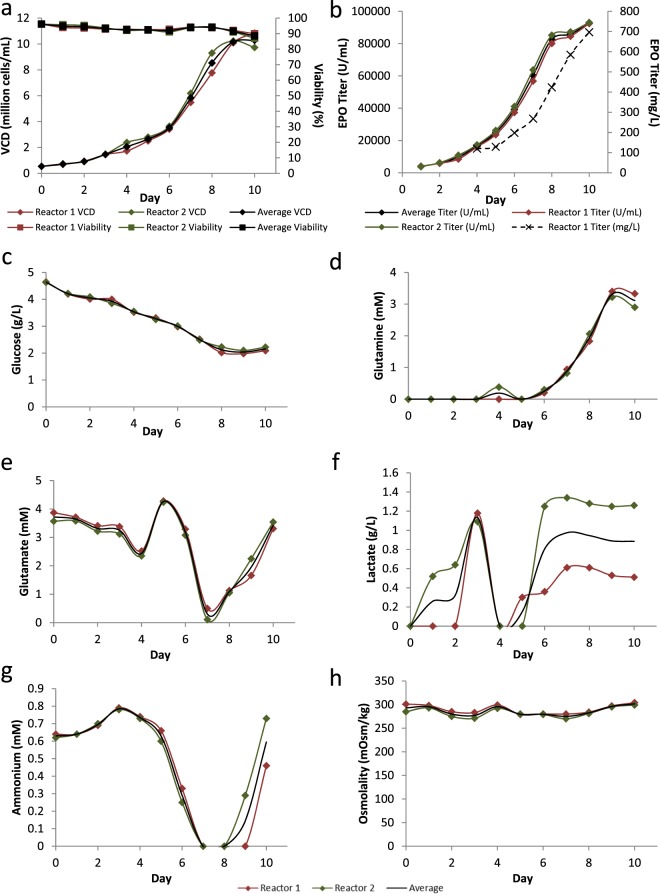
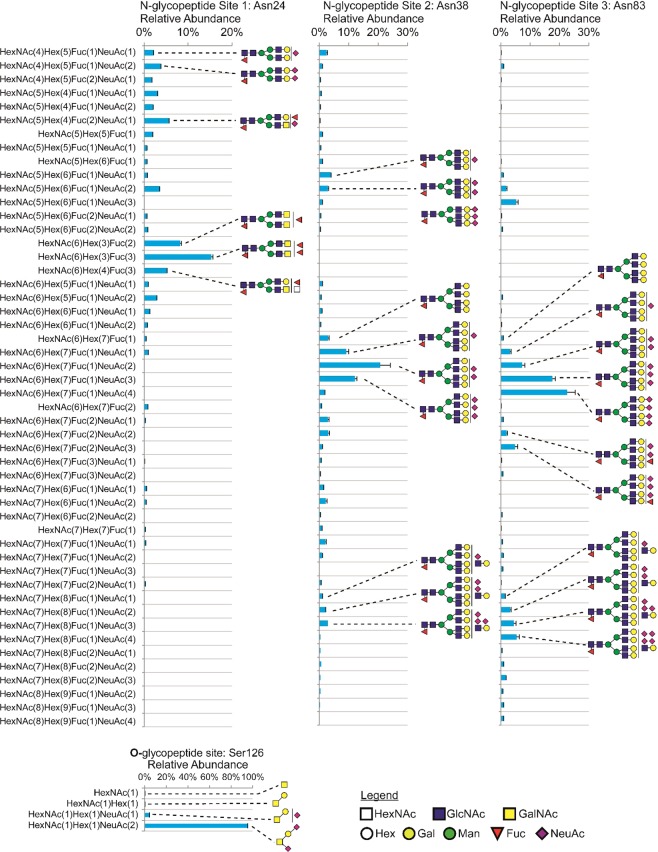
Mammalian host cell lines are the preferred expression systems for the manufacture of complex therapeutics and recombinant proteins. However, the most utilized mammalian host systems, namely Chinese hamster ovary (CHO), Sp2/0 and NS0 mouse myeloma cells, can produce glycoproteins with non-human glycans that may potentially illicit immunogenic responses. Hence, we developed a fully human expression system based on HEK293 cells for the stable and high titer production of recombinant proteins by first knocking out GLUL (encoding glutamine synthetase) using CRISPR-Cas9 system. Expression vectors using human GLUL as selection marker were then generated, with recombinant human erythropoietin (EPO) as our model protein. Selection was performed using methionine sulfoximine (MSX) to select for high EPO expression cells. EPO production of up to 92700 U/mL of EPO as analyzed by ELISA or 696 mg/L by densitometry was demonstrated in a 2 L stirred-tank fed batch bioreactor. Mass spectrometry analysis revealed that N-glycosylation of the produced EPO was similar to endogenous human proteins and non-human glycan epitopes were not detected. Collectively, our results highlight the use of a human cellular expression system for the high titer and xenogeneic-free production of EPO and possibly other complex recombinant proteins.
Conflict of interest statement
The authors are funded by A*STAR, and access to materials described in the work may be subject to terms stipulated by the agency.
Figures

Similar articles
-
Enhancement of recombinant human EPO production and glycosylation in serum-free suspension culture of CHO cells through expression and supplementation of 30Kc19.Appl Microbiol Biotechnol. 2012 Nov;96(3):671-83. doi: 10.1007/s00253-012-4203-0. Epub 2012 Jun 20. Appl Microbiol Biotechnol. 2012. PMID: 22714097
-
Highly sialylated recombinant human erythropoietin production in large-scale perfusion bioreactor utilizing CHO-gmt4 (JW152) with restored GnT I function.Biotechnol J. 2014 Jan;9(1):100-9. doi: 10.1002/biot.201300301. Epub 2013 Dec 10. Biotechnol J. 2014. PMID: 24166780
-
Improving the efficiency of CHO cell line generation using glutamine synthetase gene knockout cells.Biotechnol Bioeng. 2012 Apr;109(4):1007-15. doi: 10.1002/bit.24365. Epub 2011 Nov 21. Biotechnol Bioeng. 2012. PMID: 22068567
-
[From natural to recombinant human erythropoietin. Biotechnological production of recombinant human erythropoietin].Nephron. 1989;51 Suppl 1:20-5. doi: 10.1159/000185566. Nephron. 1989. PMID: 2644578 Review. German.
-
Appropriate mammalian expression systems for biopharmaceuticals.Arzneimittelforschung. 1998 Aug;48(8):870-80. Arzneimittelforschung. 1998. PMID: 9748718 Review.
Cited by
-
Slight Variations in the Sequence Downstream of the Polyadenylation Signal Significantly Increase Transgene Expression in HEK293T and CHO Cells.Int J Mol Sci. 2022 Dec 7;23(24):15485. doi: 10.3390/ijms232415485. Int J Mol Sci. 2022. PMID: 36555130 Free PMC article.
-
Production of high-quality SARS-CoV-2 antigens: Impact of bioprocess and storage on glycosylation, biophysical attributes, and ELISA serologic tests performance.Biotechnol Bioeng. 2021 Jun;118(6):2202-2219. doi: 10.1002/bit.27725. Epub 2021 Mar 27. Biotechnol Bioeng. 2021. PMID: 33624859 Free PMC article.
-
Chemical Glycosylation and Its Application to Glucose Homeostasis-Regulating Peptides.Front Chem. 2021 Apr 12;9:650025. doi: 10.3389/fchem.2021.650025. eCollection 2021. Front Chem. 2021. PMID: 33912539 Free PMC article. Review.
-
HEK293 Cell Line as a Platform to Produce Recombinant Proteins and Viral Vectors.Front Bioeng Biotechnol. 2021 Dec 13;9:796991. doi: 10.3389/fbioe.2021.796991. eCollection 2021. Front Bioeng Biotechnol. 2021. PMID: 34966729 Free PMC article. Review.
-
Amplification of EBNA-1 through a single-plasmid vector-based gene amplification system in HEK293 cells as an efficient transient gene expression system.Appl Microbiol Biotechnol. 2021 Jan;105(1):67-76. doi: 10.1007/s00253-020-11001-3. Epub 2020 Nov 16. Appl Microbiol Biotechnol. 2021. PMID: 33191460
References
Publication types
MeSH terms
Substances
LinkOut - more resources
Full Text Sources
Other Literature Sources
Research Materials
Miscellaneous
