. 2019 Nov 13;9(1):16683.
doi: 10.1038/s41598-019-53087-4.

Mechanisms of GABAB receptor enhancement of extrasynaptic GABAA receptor currents in cerebellar granule cells

Affiliations

Mechanisms of GABAB receptor enhancement of extrasynaptic GABAA receptor currents in cerebellar granule cells

Shailesh N Khatri et al. Sci Rep. .

Abstract

Many neurons, including cerebellar granule cells, exhibit a tonic GABA current mediated by extrasynaptic GABAA receptors. This current is a critical regulator of firing and the target of many clinically relevant compounds. Using a combination of patch clamp electrophysiology and photolytic uncaging of RuBi-GABA we show that GABAB receptors are tonically active and enhance extrasynaptic GABAA receptor currents in cerebellar granule cells. This enhancement is not associated with meaningful changes in GABAA receptor potency, mean channel open-time, open probability, or single-channel current. However, there was a significant (~40%) decrease in the number of channels participating in the GABA uncaging current and an increase in receptor desensitization. Furthermore, we find that adenylate cyclase, PKA, CaMKII, and release of Ca2+ from intracellular stores are necessary for modulation of GABAA receptors. Overall, this work reveals crosstalk between postsynaptic GABAA and GABAB receptors and identifies the signaling pathways and mechanisms involved.


Conflict of interest statement

The authors declare no competing interests.

Figures

Figure 1
Figure 1
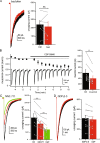
GABABRs enhance extrasynaptic GABAARs. (A) Schematic view of experimental design including whole-cell patch clamp recording from granule cells and uncaging of RuBi-GABA by 470 nm LED/Laser light pulse. (B) Left: Diagram of GABA uncaging light pulse (top) and resulting currents recorded in a granule cell in the presence of picrotoxin (+PTX), standard ACSF (black), or CGP55845 (red). The CGP trace normalized to the peak of the control trace is also displayed (pink) to show the change in decay kinetics and rise time (inset). Right: Average amplitudes of uncaging current in control (black) and in the presence of CGP55845 or saclofen (red). (C) Average rise time (left) and decay time constant (right) of GABA uncaging currents in control ACSF (black) or in the presence of CGP55845 or saclofen (red). (D) Average uncaging current amplitudes over 15 minutes in control ACSF. (E,F) Example traces (left) and average amplitudes (right) of uncaging currents in control ACSF (black) and in the presence of CGP55845 (red) in stellate cells (E) and Purkinje cells (F). (G) Example traces (left) and average amplitudes (right) of evoked inhibitory postsynaptic currents in control ACSF (black) and in the presence of CGP55845 (red) in granule cells. (H) Example traces of tonic GABAA receptor currents in control ACSF (left) and in the presence of CGP (middle). Average holding current values (dashed red line) and Gaussian fits of histograms of current values (black lines) before and after bicuculin application are also shown. Right: Average tonic GABAA receptor currents in control ACSF (black) and in the presence of CGP (red). Data from individual cells are plotted as connected gray markers. (*) indicates p-value ≤ 0.05, (**) indicates p-value ≤ 0.01, (***) indicates p-value ≤ 0.001, ns indicates p-value > 0.05.
Figure 2
Figure 2
GABABRs are tonically active in granule cells. (A) Representative traces (left) and average amplitudes (right) of uncaging current in control ACSF (black) and in the presence of baclofen (red). (B) left: Average current amplitudes (circles) and example traces (inset) following pressure application of muscimol though out the time course of the experiment. CGP55845 was bath applied at time = 0. Right: Average muscimol current amplitudes in control ACSF (black) and in the presence of CGP55845 (red). (C) Representative traces (left) and average amplitudes (right) of uncaging currents in control ACSF (black), in the presence of NNC-711 (red), and in CGP55845 (green). (D) Representative traces (left) and average amplitudes (right) of uncaging currents in control ACSF (black) and in the presence of CGP55845 (red) when GDP-β-S is included in the internal solution. Data from individual cells are plotted as connected gray markers. (**) indicates p-value ≤ 0.01, ns indicates p-value > 0.05.
Figure 3
Figure 3
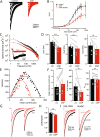
GABABR inhibition reduces the number of active GABAARs. (A) Representative traces of uncaging currents elicited by varying the uncaging laser intensity in control ACSF (left) and in the presence of CGP55845 (right). (B) Dose response curve showing the relationship between uncaging laser power and uncaging current amplitude in control ACSF (black) and in the presence of CGP55845 (red). Data are fit with Hill equation (lines). The CGP data normalized to the maximum current in control is also shown (open circles). (C) Example current traces (inset) and power spectral density plot of uncaging currents in control ACSF (black) and in the presence of CGP55845 (red). (D) Average values of fast (left) and slow (middle, right) time-constants determined by power spectral analysis in control ACSF (black) and in the presence of CGP55845 (red). (E) Example plot of non-stationary fluctuation analysis. Plot shows mean current amplitudes plotted against the variance of the current in control ACSF (black) and in the presence of CGP55845 (red) for a single cell. (F) Average single channel current (left), number of channels participating in the current (middle), and channel open probability (PO max; right) in control ACSF (black) and in the presence of CGO55845 (red). (G) Representative uncaging current traces in control ACSF (black) on in the presence of CGP (red) following a pair of uncaging light pulses. The CGP trace normalized to the first peak of the control trace is also shown (pink) to demonstrate the change in paired-pulse ratio. (H) Average paired-pulse ratio in control ACSF (black) or in the presence of CGP55845 (red). (I) Left: Example traces of GABA uncaging currents in control ACSF (black) or in the presence of CGP (red). The CGP trace normalized to the peak of the control trace is also shown (pink) for comparison of kinetics. Right: Simulated GABAAR gating showing responses with relatively slow (black) and fast (red) desensitization. The fast desensitization trace normalized to the peak of the slow desensitization trace is also shown (pink) for comparison. Control data (black) in (A) and (B) were previously published in Khatri et al.. Data from individual cells are plotted as connected gray markers. (**) indicates p-value ≤ 0.01, (***) indicates p-value ≤ 0.001, ns indicates p-value > 0.05.
Figure 4
Figure 4
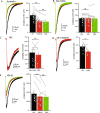
Intracellular kinase dependent enhancement of GABAARs. (A) Representative uncaging current traces (left) and average current amplitudes (right) in control ACSF (black), in the presence of the adenylate cyclase activator, forskolin (red) and following the addition of CGP55845 (green). (B) Representative uncaging current traces (left) and average current amplitudes (right) in control ACSF (black), in the presence of the adenylate cyclase inhibitor, SQ-22536 (red) and in the presence of CGP55845 (green). (C) Representative uncaging current traces (left) and average current amplitudes (right) in control ACSF (black) and in the presence of CGP55845 (red) when the PKA inhibitor, PKI 14–22, is included in the internal solution. (D) Representative uncaging current traces (left) and average current amplitudes (right) in control ACSF (black) and in the presence of CGP55845 (red) when the PKC inhibitor GF-109203X is included in the bath solution. (E) Representative uncaging current traces (left) and average current amplitudes (right) in control ACSF (black), in the presence of the CaMKII inhibitor, KN-62 (red) and following the addition of CGP55845 (green). Data from individual cells are plotted as connected gray markers. (**) indicates p-value ≤ 0.01, (***) indicates p-value ≤ 0.001, ns indicates p-value > 0.05.
Figure 5
Figure 5
Intracellular calcium dependent enhancement of GABAARs. (A) Representative uncaging current traces (left) and average current amplitudes (right) in control ACSF (black), in the presence of the EGTA-AM (red) and following the addition of CGP55845 (green). (B) Representative uncaging current traces (left) and average current amplitudes (right) in control ACSF (black) and in the presence of CGP55845 (red) when high (10 mM) EGTA is included in the internal solution. (C) Representative uncaging current traces (left) and average current amplitudes (right) in 0 calcium ACSF (black) and following application of CGP55845 (red). (D) Representative uncaging current traces (left) and average current amplitudes (right) in the presence of nifedipine (black), and following addition of CGP55845 (red). (E) Representative uncaging current traces (left) and average current amplitudes (right) in the presence of dantrolene (black) and following addition of CGP55845 (red). Data from individual cells are plotted as connected gray markers. (**) indicates p-value ≤ 0.01, (***) indicates p-value ≤ 0.001, ns indicates p-value > 0.05.
Figure 6
Figure 6
GABABR signaling model. (A) Diagram of the signaling mechanism linking GABABR activation to enhancement of extrasynaptic GABAARs. (B) Chart indicating predicted changes at each step in the signaling pathway when GABABRs are activated (GABA) or inhibited (CGP).

Similar articles

Cited by

References

    1. Essrich C, Lorez M, Benson JA, Fritschy JM, Luscher B. Postsynaptic clustering of major GABAA receptor subtypes requires the gamma 2 subunit and gephyrin. Nature neuroscience. 1998;1:563–571. doi: 10.1038/2798. - DOI - PubMed
    1. Brickley SG, Cull-Candy SG, Farrant M. Single-channel properties of synaptic and extrasynaptic GABAA receptors suggest differential targeting of receptor subtypes. The Journal of neuroscience: the official journal of the Society for Neuroscience. 1999;19:2960–2973. doi: 10.1523/JNEUROSCI.19-08-02960.1999. - DOI - PMC - PubMed
    1. Sun MY, et al. Chemogenetic Isolation Reveals Synaptic Contribution of delta GABAA Receptors in Mouse Dentate Granule Neurons. The Journal of neuroscience: the official journal of the Society for Neuroscience. 2018;38:8128–8145. doi: 10.1523/JNEUROSCI.0799-18.2018. - DOI - PMC - PubMed
    1. Wei W, Zhang N, Peng Z, Houser CR, Mody I. Perisynaptic localization of delta subunit-containing GABA(A) receptors and their activation by GABA spillover in the mouse dentate gyrus. The Journal of neuroscience: the official journal of the Society for Neuroscience. 2003;23:10650–10661. doi: 10.1523/JNEUROSCI.23-33-10650.2003. - DOI - PMC - PubMed
    1. Bright DP, et al. Profound desensitization by ambient GABA limits activation of delta-containing GABAA receptors during spillover. The Journal of neuroscience: the official journal of the Society for Neuroscience. 2011;31:753–763. doi: 10.1523/JNEUROSCI.2996-10.2011. - DOI - PMC - PubMed

Publication types

LinkOut - more resources