. 2019 Nov 14;4(22):e129687.
doi: 10.1172/jci.insight.129687.

Reciprocal regulation of Th2 and Th17 cells by PAD2-mediated citrullination

Affiliations

Reciprocal regulation of Th2 and Th17 cells by PAD2-mediated citrullination

Bo Sun et al. JCI Insight. .

Abstract

Dysregulated citrullination, a unique form of posttranslational modification catalyzed by the peptidylarginine deiminases (PADs), has been observed in several human diseases, including rheumatoid arthritis. However, the physiological roles of PADs in the immune system are still poorly understood. Here, we report that global inhibition of citrullination enhances the differentiation of type 2 helper T (Th2) cells but attenuates the differentiation of Th17 cells, thereby increasing the susceptibility to allergic airway inflammation. This effect on Th cells is due to inhibition of PAD2 but not PAD4. Mechanistically, PAD2 directly citrullinates GATA3 and RORγt, 2 key transcription factors determining the fate of differentiating Th cells. Citrullination of R330 of GATA3 weakens its DNA binding ability, whereas citrullination of 4 arginine residues of RORγt strengthens its DNA binding. Finally, PAD2-deficient mice also display altered Th2/Th17 immune response and heightened sensitivity to allergic airway inflammation. Thus, our data highlight the potential and caveat of PAD2 as a therapeutic target of Th cell-mediated diseases.

Keywords: Adaptive immunity; Allergy; Autoimmunity; Immunology; T cells.


Conflict of interest statement

Conflict of interest: The authors have declared that no conflict of interest exists.

Figures

Figure 1
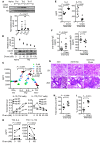
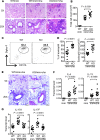
Figure 1. Modulation of in vivo and in vitro differentiation of Th cells by global inhibition of citrullination.
(A) Indicated C57BL/6 Th cells were left unstimulated (–) or restimulated with anti-CD3 (+) overnight. The level of cit-H3 was examined with Western blotting using anti–cit-H3. The normalized density of cit-H3 is shown in the bar graph (n = 3, 1-way ANOVA). (B and C) C57BL/6 effector Th cells were generated in the presence of Cl-am at indicated concentrations for 5 days. Whole Th2 extract was examined with Western blotting using indicated antibodies. Representative blots and normalized density of cit-H3 from 2 experiments are shown in B. The expression of indicated cytokines by the Th cells after restimulation with anti-CD3 is shown in C (n = 4, 1-way ANOVA). (D) Primary human Th cells from 5 healthy donors were differentiated in vitro into Th2 or Th17 cells in the presence or absence of Cl-am (100 μM). The production of IL-4 and IL-17A after restimulation with anti-CD3 was quantified with ELISA. Data points from the same donors are connected with lines (1-tailed paired Student’s t test). (EI) Allergic airway inflammation was induced in C57BL/6 mice (n = 6 per group) in the absence or presence of Cl-am. Splenocytes were restimulated with ovalbumin for 72 hours. The levels of IL-4 and IL-17A in supernatant are shown in E. Imm, immunized; cha, challeneged. The levels of ovalbumin-specific (ova-specific) IgE and IgG1 in serum are shown in F. Representative H&E staining of the lung tissue is shown in G. Scale bars: 100 μm. The total number of cells (H) and the percentage of eosinophils (I) in bronchial lavage are also shown. Statistical analysis for E, F, H, and I was performed with 2-tailed Student’s t test.
Figure 2
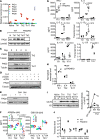
Figure 2. Recapitulating the effects of Cl-am by inhibiting PAD2 but not PAD4.
(A) The transcript levels of indicated PADs in Th cells (n = 3) and macrophages (n = 2) of C57BL/6 mice were measured with real-time PCR and normalized against the levels of actin. (B) The levels of PAD2 proteins in indicated C57BL/6 Th cells and PAD2-KO Th2 cells were examined with Western blotting using indicated antibodies. (C) At indicated time points during the differentiation of WT Th2 and Th17 cells, the level of PAD2 protein was examined with Western blotting. A parallel gel was probed with anti-tubulin for loading control. (D and E) WT Th cells were stimulated with anti-CD3, anti-CD28, and/or IL-2 in the absence (D) or presence (E) of cyclosporine A (CsA) or sotrastaurin (Sot) for 2 days. The level of PAD2 proteins was examined with Western blotting. Representative Western blots from 2 experiments are shown in BD. (F) C57BL/6 effector Th cells were generated in the presence of AFM30a (left panel) or GSK199 (right panel) at indicated concentrations. The expression of indicated cytokines by the Th cells after restimulation with anti-CD3 is shown (n = 3–4, 1-way ANOVA). (GJ) Th cells obtained from WT DBA/1J (GJ, n = 3–4), PAD2-KO (G, I, and J, n = 3–5), or PAD4-KO (H, n = 2) mice were differentiated into Th1, Th2, and Th17 cells for 5 days. The production of indicated cytokines after restimulation with anti-CD3 was measured with ELISA or real-time PCR (G and H, 2-tailed Student’s t test for G). Data from the same experiments are connected with lines in H. Whole cell extract from WT DBA/1J or PAD2-KO Th cells were examined with Western blotting using anti-citH3 (I). A parallel gel was probed with anti-H3 for loading controls. The normalized density of cit-H3 of indicated cells is shown in the dot blot of I. The transcript levels of PADs in restimulated WT DBA/1J, and PAD2-KO Th2 cells were quantified with real-time PCR and shown in J (n = 3–4).
Figure 3
Figure 3. PAD2-mediated citrullination reciprocally regulates the activity of GATA3 and RORγt.
(A and B) Differentiated WT DBA/1J (W) and PAD2-KO (K) Th cells were restimulated with anti-CD3 (A and B) or left unstimulated (B) for 24 hours. The transcript levels of GATA3 and RORγt from 3 independent experiments are shown in A (2-tailed Student’s t test). The levels of GATA3 and RORγt proteins were analyzed with Western blotting. Representative Western blots from 5 independent experiments are shown in B. The normalized density of GATA3 and RORγt proteins is shown in the bar graphs of B (2-tailed Student’s t test). The averaged levels in WT cells without restimulation were arbitrarily set as 1. (C and D) HEK-293 cells were transfected with indicated luciferase reporters and expression vectors. Luciferase activity obtained from cells without exogenous PAD2, GATA3, and RORγt was arbitrarily set as 1 (2-tailed paired Student’s t test). Data points from the same experiments are connected with lines. Fractions of the cell extract from 2 experiments was subjected to Western blotting using indicated antibodies to demonstrate the expression of exogenous proteins and endogenous Lamin B. Representative Western blots are shown.
Figure 4
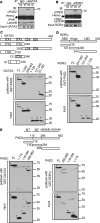
Figure 4. PAD2 physically interacts with GATA3 and RORγt.
Whole cells extract was prepared from differentiated WT DBA/1J (W) and PAD2-KO (K) Th2 (A) and Th17 (B) cells and subjected to immunoprecipitation with anti-GATA3 (A), anti-RORγt (B) or control IgG (A and B). The immunoprecipitate was probed with anti-PAD2 in Western blotting (top panels). A fraction of the unprecipitated extract was probed with anti-GATA3 (A), anti-RORγt (B) and anti-Lamin B as input control (middle and bottom panels). Representative Western blots from 2 experiments are shown. (CE) GST-PAD2 (C and D), GST-GATA3 (E, left panels), or GST-RORγt (E, right panels) was used to pull down various truncated His-tagged GATA3 (C), RORγt (D), or PAD2 (E) expressed in HEK-293 cells. Whole cell extract from the transfected HEK-293T cells (the bottom panels) and pulldown extract (the top panels) were probed with anti-His. Schematic diagrams of truncated GATA3 (C), RORγt (D), and PAD2 (E) are also shown. The asterisks in the Western blots of CE mark exogenous His-GATA3 (C), His-RORγt (D), and His-PAD2 (E). Representative Western blots from 3 experiments are shown in CE. TA, transactivation domain; Zn, zinc finger; DBD, DNA binding domain; LBD, ligand binding domain; Ig, immunoglobulin domain; and FL, full length.
Figure 5
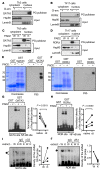
Figure 5. PAD2-mediated citrullination regulates the DNA binding of GATA3 and RORγt.
(AD) Cytoplasmic and nuclear extract was prepared from WT DBA/1J (A and B, W in C and D) or PAD2-KO (K in C and D) mouse Th2 or Th17 cells differentiated in the presence (+ in A and B) or absence (C and D, and – in A and B) of Cl-am, incubated with PG-biotin, pulled down with streptavidin beads, and probed with anti-GATA3 (A and C) or anti-RORγt (B and D) in Western blotting (top panels). A fraction of the PG-biotin–labeled extract prior to pulldown was probed with anti-Hsp90 or anti–Lamin B to serve as input controls (middle and bottom panels). Data shown is from 1 experiment. (E and F) Recombinant GST, GST-GATA3 (E), and GST-RORγt (F) were incubated with (+) or without () PAD2, fractionated in SDS-PAGE gels, stained with Coomassie blue (left panels), and probed with F95 (right panels) in Western blotting. Data shown are representative blots from at least 2 experiments. (G and H) The recombinant proteins from E and F were incubated with indicated DNA probes in EMSA. Representative EMSA gels from 3 experiments are shown. The normalized density of the shifted probes (1 = the averaged density obtained with native proteins) is shown in the dot graphs (2-tailed paired Student’s t test). Data from the same experiment are connected with lines. (I and J) EMSA was performed by incubating nuclear extract from WT (W) or PAD2-KO (K) Th2 (I) or Th17 (J) cells with GATA and ROR probes, respectively, in the absence or presence of IgG, anti-GATA3 (αG3) or anti-RORγt (αRγt). Representative EMSA gels from 3 experiments are shown, and the shifted probes are marked with arrows. The relative density of the shifted probes is shown in the dot graphs. The density from the probes shifted by the WT extract in the absence of IgG was arbitrarily set as 1.
Figure 6
Figure 6. Identification of functionally critical citrullination sites of GATA3 and RORγt.
(A and B) Schematic diagrams of the zinc finger domains of GATA3 (A) and RORγt (B) are shown. The citrullination sites are marked. TA and Zn represent transactivation domain and zinc ion, respectively. (CH) WT and indicated R-to-K mutants of recombinant GATA3 and RORγt were subjected to in vitro citrullination with PAD2 and stained with Coomassie blue as loading controls (bottom panels of C and F). Their citrullination status was examined with Western blotting using F95 (top panels of C and F, n = 3). The normalized density of the full-length citrullinated proteins (arrows) is shown in the dot plot of C and F. The native and citrullinated proteins were then incubated with indicated DNA probes in EMSA (D and G, n = 3). The normalized density of the shifted probes is shown in the dot plot of D and G. The transcription activity of the WT and various R-to-K mutants was examined with luciferase assays in the presence or absence of PAD2 according to the methods described in Figure 3, C and D. The PAD2-induced fold changes in the activity of GATA3 (E, n = 4) or RORγt (H, n = 4) are shown. One-way ANOVA with correction for multiple comparison was used in C, D, F, and G. Two-tailed Student’s t test was used to compared WT GATA3 with R330K in E, WT GATA3 with 5R-K in E, and WT RORγt with 4R-K in H.
Figure 7
Figure 7. Structural basis of the effects of citrullination on the DNA binding of GATA3 and RORγt.
(AC) Crystal structures of PDB3VD6 (A) and PDB1GA5 (B and C) were used to generate a hypothesis of the effect of citrullination on the DNA binding of GATA3 and RORγt, respectively. The relevant amino acid residues and their distance between one another were labeled. The gray sphere in B represents a zinc ion, whereas the red spheres in B and C represent water molecules.
Figure 8
Figure 8. Deficiency of PAD2 increases the susceptibility to allergic airway inflammation.
(AG) Allergic airway inflammation was induced in WT DBA/1J and PAD2-KO mice (n = 12 per group) according to the protocol described in Methods. Representative H&E staining of lung sections from immunized/unchallenged WT DBA/1J (imm), immunized/challenged WT DBA/1J (WT/imm+cha), and immunized/challenged PAD2-KO (KO/imm+cha) mice were shown in A. Scale bars: 100 μm. The total number of cells in bronchial lavage is shown in B. Eosinophils in bronchial lavage were identified with FACS as CD11b+Siglec-F+ cells. Representative FACS plots are shown in C. The percentage and total number of eosinophils in bronchial lavage are shown in D. Mucus-producing cells were identified with PAS stain (bright pink stain). Representative sections are shown in E. Scale bars: 100 µm. The transcript levels of indicated Th2 and Th17 cytokines in lung tissue were measured with real-time PCR and shown in F and G, respectively. Statistical analysis was performed with 2-tailed Student’s t test.

Similar articles

Cited by

References

    1. Witalison EE, Thompson PR, Hofseth LJ. Protein Arginine Deiminases and Associated Citrullination: Physiological Functions and Diseases Associated with Dysregulation. Curr Drug Targets. 2015;16(7):700–710. doi: 10.2174/1389450116666150202160954. - DOI - PMC - PubMed
    1. Esposito G, et al. Peptidylarginine deiminase (PAD) 6 is essential for oocyte cytoskeletal sheet formation and female fertility. Mol Cell Endocrinol. 2007;273(1-2):25–31. doi: 10.1016/j.mce.2007.05.005. - DOI - PubMed
    1. Zhang X, et al. Peptidylarginine deiminase 1-catalyzed histone citrullination is essential for early embryo development. Sci Rep. 2016;6:38727. - PMC - PubMed
    1. Li P, Li M, Lindberg MR, Kennett MJ, Xiong N, Wang Y. PAD4 is essential for antibacterial innate immunity mediated by neutrophil extracellular traps. J Exp Med. 2010;207(9):1853–1862. doi: 10.1084/jem.20100239. - DOI - PMC - PubMed
    1. Demoruelle MK, Deane K. Antibodies to citrullinated protein antigens (ACPAs): clinical and pathophysiologic significance. Curr Rheumatol Rep. 2011;13(5):421–430. doi: 10.1007/s11926-011-0193-7. - DOI - PMC - PubMed

Publication types

Substances