. 2020 Jan 17;94(3):e01270-19.
doi: 10.1128/JVI.01270-19. Print 2020 Jan 17.

Impact of Antiretroviral Therapy Duration on HIV-1 Infection of T Cells within Anatomic Sites

Affiliations

Impact of Antiretroviral Therapy Duration on HIV-1 Infection of T Cells within Anatomic Sites

Eunok Lee et al. J Virol. .

Abstract

Understanding the impact of antiretroviral therapy (ART) duration on HIV-infected cells is critical for developing successful curative strategies. To address this issue, we conducted a cross-sectional/inter-participant genetic characterization of HIV-1 RNA from pre- and on-therapy plasmas and HIV-1 DNA from CD4+ T cell subsets derived from peripheral blood (PB), lymph node (LN), and gut tissues of 26 participants after 3 to 17.8 years of ART. Our studies revealed in four acute/early participants who had paired PB and LN samples a substantial reduction in the proportion of HIV-infected cells per year on therapy within the LN. Extrapolation to all 12 acute/early participants estimated a much smaller reduction in the proportion of HIV-1-infected cells within LNs per year on therapy that was similar to that in the participants treated during chronic infection. LN-derived effector memory T (TEM) cells contained HIV-1 DNA that was genetically identical to viral sequences derived from pre- and on-therapy plasma samples. The proportion of identical HIV-1 DNA sequences increased within PB-derived TEM cells. However, the infection frequency of TEM cells in PB was stable, indicating that cellular proliferation that compensates for T cell loss over time contributes to HIV-1 persistence. This study suggests that ART reduces HIV-infected T cells and that clonal expansion of HIV-infected cells maintains viral persistence. Importantly, LN-derived TEM cells are a probable source of HIV-1 genomes capable of producing infectious HIV-1 and should be targeted by future curative strategies.IMPORTANCE HIV-1 persists as an integrated genome in CD4+ memory T cells during effective therapy, and cessation of current treatments results in resumption of viral replication. To date, the impact of antiretroviral therapy duration on HIV-infected CD4+ T cells and the mechanisms of viral persistence in different anatomic sites is not clearly elucidated. In the current study, we found that treatment duration was associated with a reduction in HIV-infected T cells. Our genetic analyses revealed that CD4+ effector memory T (TEM) cells derived from the lymph node appeared to contain provirus that was genetically identical to plasma-derived virions. Moreover, we found that cellular proliferation counterbalanced the decay of HIV-infected cells throughout therapy. The contribution of cellular proliferation to viral persistence is particularly significant in TEM cells. Our study emphasizes the importance of HIV-1 intervention and provides new insights into the location of memory T cells infected with HIV-1 DNA, which is capable of contributing to viremia.

Keywords: CD4+ T cell subsets; HIV-1; HIV-1 persistence; acute/early infection; anatomic sites; cellular proliferation; chronic infection; long-term antiretroviral therapy; single-genome sequencing; single-proviral sequencing.


Figures

FIG 1
FIG 1
Example of the gating strategy for classical CD4+ T cell populations from peripheral blood. Shown is the gating strategy for the CD4+ TN, TSCM, TCM, TTM, and TEM cell subsets.
FIG 2
FIG 2
Example of the gating strategy for sorting CXCR5+ CCR6 and CXCR5 CCR6+ CD4+ T cell memory populations from peripheral blood. Shown is the gating strategy for memory lymph node-homing (X5+ R6) and memory gut-homing (X5 R6+) CD4+ T cell subsets.
FIG 3
FIG 3
Example of the gating strategy for sorting classical CD4+ T cell populations from lymph nodes. Shown is the gating strategy for CD4+ TN, TCM, TTM, and TEM cell subsets.
FIG 4
FIG 4
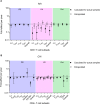
Fold effect of infection frequency during each year on ART. Shown is the fold effect per year of therapy on infection frequency in a broad range of CD4+ T cell subsets sorted from PB (blue shading), LN (pink shading), and gut (green shading) tissues obtained from the AHI group (A) and the CHI group (B). The fold effect per year on therapy is a multiplicative effect that is equivalent to a fold change in the proportion of HIV-1-infected T cells from earlier to later time points during ART. For the LN, the fold effect per year on ART within 4 actual participant samples (with data from both PB and LNs) in the AHI group is indicated by the solid squares. The extrapolated fold effect per year on ART represents all 12 participants in the AHI group (open squares). For the LNs of the CHI group, the fold effect per year on ART derived from 8 actual participant samples (with data from both PB and LNs) is indicated by the solid squares, and the extrapolated fold effect per year of therapy for all 14 participants is indicated by the open squares. For each T cell subset, the fold effect per year on therapy was estimated when samples were available from at least 4 participants. The PB sample obtained from participant 2275 after 15.3 years of therapy was excluded from this cross-sectional analysis (Table 1). The error bars indicate the 95% confidence intervals of the infection frequency fold effect per year. *, P < 0.05; **, P < 0.01; ***, P < 0.001. The effects were estimated by negative binomial regression.
FIG 5
FIG 5
Numbers of HIV-1-infected T cells per million over years on ART (AHI group). The numbers of HIV-1-infected cells per million within CD4+ T cell subsets sorted from PB, LNs, and gut are shown. The error bars indicate the 95% confidence interval for each point. The red lines are derived from the fitted values calculated using the following equation at the sampling time points: y = 1,000,000 × exp[intercept + slope × (years on ART)]. The coefficients (intercept and slope) used to derive the fitted values for each T cell subset sorted from an anatomic site are shown.
FIG 6
FIG 6
Numbers of HIV-1-infected T cells per million over years on ART (CHI group). The numbers of HIV-1-infected cells per million within CD4+ T cell subsets sorted from PB, LNs, and gut are shown. The error bars indicate the 95% confidence interval for each point. The red lines are derived from the fitted values calculated using the following equation at the sampling time points: y = 1,000,000 × exp[intercept + slope × (years on ART)]. The coefficients (intercept and slope) used to derive the fitted values for each T cell subset sorted from an anatomic site are shown.
FIG 7
FIG 7
Proportions of defective HIV-1 DNA sequences in the p6-RT region during ART. Shown are the changes in the percentages of defective HIV-1 DNA p6-RT sequences during years on ART in PB (blue circles), LN (pink circles), and gut (green circles) tissues obtained from the AHI group (A to C) and the CHI group (D to F). The changes in the odds that a viral sequence is genetically defective during ART are indicated as OR per year on therapy. The 95% confidence intervals for the ORs are indicated in square brackets. Estimated by mixed-effects logistic regression, the fitted curves (red lines) follow the following equation: y = 100 × {1 + exp[−(k + xs)]}−1, where y represents the proportions of defective HIV-1 DNA p6-RT sequences, k represents the y intercept, s represents the coefficient calculated as log(OR), and x represents the years on ART. Each HIV-1 DNA sequence is the unit of analysis, and the denominator for each sequence is a single HIV-1-infected T cell (33, 73). The confidence intervals of each data point were derived from the binomial distribution. The odds ratios and their confidence intervals were estimated by logistic regression models.
FIG 8
FIG 8
Proportions of defective HIV-1 DNA sequences from CD4+ T cell subsets during ART (AHI group). The effects of ART duration on the proportions of defective HIV-1 DNA p6-RT sequences in CD4+ T cell subsets sorted from PB (A to D), LNs (E to H), and gut (I to J) are indicated as OR per year on therapy. The 95% confidence intervals for the ORs are indicated in square brackets. Estimated by mixed-effects logistic regression, the fitted curves (red lines) follow the following equation: y = 100 × {1 + exp[−(k + xs)]}−1, where y represents the proportions of defective HIV-1 DNA p6-RT sequences, k represents the y intercept, s represents the coefficient calculated as log(OR), and x represents the years on ART. Each HIV-1 DNA sequence is the unit of analysis, and the denominator for each sequence is a single HIV-1-infected T cell (33, 73). The confidence interval of each data point was derived from the binomial distribution. The odds ratios and their confidence intervals were derived by logistic regression models. Solid blue diamonds, TN cells; solid blue triangles, TCM cells; solid blue circles, TTM cells; solid blue squares, TEM cells, all derived from PB. Solid pink diamonds, TN cells; solid pink triangles, TCM cells; solid pink circles, TTM cells; solid pink squares, TEM cells, all derived from LNs. Solid green triangles, TCTM cells; solid green squares, TEM cells, all derived from the gut.
FIG 9
FIG 9
Proportions of defective HIV-1 DNA sequences from CD4+ T cell subsets during ART (CHI group). The effects of ART duration on the proportions of defective HIV-1 DNA p6-RT sequences in CD4+ T cell subsets sorted from PB (A to F), LNs (G to J), and gut (K to L) are indicated as OR per year on therapy. The 95% confidence intervals for the ORs are indicated in square brackets. Estimated by mixed-effects logistic regression, the fitted curves (red lines) follow the following equation: y = 100 × {1 + exp[−(k + xs)]}−1, where y represents the proportions of defective HIV-1 DNA p6-RT sequences, k represents the y intercept, s represents the coefficient calculated as log(OR), and x represents the years on ART. Each HIV-1 DNA sequence is the unit of analysis, and the denominator for each sequence is a single HIV-1-infected T cell (33, 73). The confidence interval of each data point was derived from the binomial distribution. The odds ratios and their confidence intervals were estimated by logistic regression models. Solid blue diamonds, TN cells; solid blue triangles, TCM cells; solid blue circles, TTM cells; solid blue squares, TEM cells; open blue triangles, gut-homing (X5 R6+) cells; open blue triangles, lymph-homing (X5+ R6) cells, all derived from PB. Solid pink diamonds, TN cells; solid pink triangles, TCM cells; solid pink circles, TTM cells; solid pink squares, TEM cells, all derived from LNs. Solid green triangles, TCTM cells; solid green squares, TEM cells, all derived from the gut.
FIG 10
FIG 10
Odds that an HIV-1 sequence was defective in anatomic sites versus plasma samples. Shown is a comparison of the odds that an HIV-1 RNA sequence from pre- and on-ART plasma samples was defective versus the odds that a viral DNA sequence from PB, LN, and gut tissues was defective for the AHI group (open squares) and the CHI group (solid squares). The comparison of the odds is indicated as the OR; the error bars indicate the 95% confidence intervals for the ORs. *, P < 0.05; **, P < 0.01; ***, P < 0.001; ****, P < 0.0001. p6-RT sequences were used for the genetic comparisons. The odds ratios and their confidence intervals were estimated by logistic regression models.
FIG 11
FIG 11
Odds that an HIV-1 sequence was defective in CD4+ T cell subsets versus plasma samples. Shown are comparisons of the odds that a viral sequence was defective in CD4+ T cell subsets sorted from PB, LN, and gut tissues derived from the AHI group (A) and the CHI group (B) to the odds that they were defective in pre- and on-therapy plasma samples. Blue shading, odds ratio of the CD4+ T cell subset to pretherapy plasma; yellow shading, odds ratio of CD4+ T cell subset to on-therapy plasma. *, P < 0.05; **, P < 0.01; ****, P < 0.0001. p6-RT sequences were used for the comparisons. The odds ratios and their confidence intervals were derived by logistic regression models.
FIG 12
FIG 12
HIV-1 genetic comparisons between pre- and on-therapy plasma samples and T cell subsets from each anatomic site. Shown are comparisons of the odds that an HIV-1 DNA sequence was genetically identical to HIV-1 RNA sequences derived from pretherapy (A and B) or on-therapy (C and D) plasma samples. The odds ratios were derived from every pairwise comparison between CD4+ T cell subsets sorted from PB (A and C) and LNs (B and D) obtained from the CHI group. The comparison of the odds is indicated as the OR, and the error bars indicate 95% confidence intervals of the ORs. *, P < 0.05; **, P < 0.01. p6-RT sequences were used for the genetic comparisons. The odds ratios and their confidence intervals were estimated by logistic regression models.
FIG 13
FIG 13
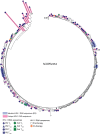
Representative phylogenetic tree showing HIV-1 sequence comparisons between plasma and CD4+ T cell subsets. The phylogenetic regions containing HIV-1 DNA p6-RT sequences that were genetically identical to the viral sequences from the pretherapy plasma, to the on-therapy plasma, and to both of the plasma samples are marked. Individual HIV-1 DNA sequences derived from TN (diamonds), TCM (triangles), TTM (circles), and TEM (squares) cells sorted from PB (blue) and LNs (pink) are shown. Individual HIV-1 RNA sequences derived from pre- and on-therapy plasma are also shown. The maximum-likelihood phylogenetic tree was constructed with MEGA6.
FIG 14
FIG 14
Representative phylogenetic tree showing identical and unique HIV-1 DNA sequences. Individual HIV-1 DNA p6-RT sequences that were genetically unique and located on single branches within a phylogenetic tree are colored pink. The unique viral sequences were genetically distinct and not identical to any other viral RNA and/or DNA sequence. Identical HIV-1 DNA sequences from EIS are colored blue. Individual HIV-1 DNA sequences derived from TN (diamonds), TCM (triangles), TTM (circles), and TEM (squares) cells sorted from PB (blue) are shown. Individual viral DNA sequences derived from TN, TCTM, and TEM cells sorted from gut (green) are also shown. Individual HIV-1 RNA sequences derived from pre- and on-therapy plasma are shown. The maximum-likelihood phylogenetic tree was constructed with MEGA6.
FIG 15
FIG 15
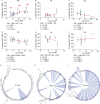
Genetically identical and unique HIV-1 DNA sequences derived from anatomic sites during ART. (A to F) The associations of the percentages of identical (A to C) and unique (D to F) HIV-1 DNA p6-RT sequences with years on ART in PB (A and D), LN (B and E), and gut (C and F) tissues derived from the CHI group are shown. The effects of therapy duration on the odds that a viral sequence was genetically identical are indicated as OR per year on therapy. The 95% confidence intervals for ORs are indicated in square brackets. Estimated by mixed-effects logistics regression, the fitted curves (red lines) follow the following equation: y = 100 × {1 + exp[−(k + xs)]}−1, where y represents the proportions of genetically identical HIV-1 DNA p6-RT sequences, k represents the y intercept, s represents the coefficient calculated as log(OR), and x represents the years on ART. Each HIV-1 DNA sequence is the unit of analysis, and the denominator for each sequence is a single HIV-1-infected T cell (33, 73). The confidence interval of each data point was estimated from the binomial distribution. The confidence interval of each odds ratio was estimated by logistic regression models. (G to I) Maximum-likelihood phylogenetic trees indicating an increase in expansions of genetically identical HIV-1 DNA p6-RT sequences (blue) at 3.5 years (participant 1292) (G), 10.8 years (participant 2472) (H), and 17.3 years (participant 2013) (I) after ART initiation, as indicated in panel A (red arrows). The trees included HIV-1 DNA p6-RT sequences derived from TN (diamonds), TCM (solid triangles), TTM (circles), TEM (solid squares), X5+ R6 (open squares), and X5 R6+ (open triangles) cells sorted from PB.
FIG 16
FIG 16
Genetically identical and unique HIV-1 DNA sequences from PB-derived CD4+ T cell subsets during ART. The effects of ART duration on the percentages of identical (top) and unique (bottom) HIV-1 DNA p6-RT sequences derived from TN (A), TCM (B), TTM (C), and TEM (D) cells sorted from PB of the CHI group are indicated as OR per year on therapy. The 95% confidence intervals for the ORs are indicated in square brackets. Estimated by mixed-effects logistic regression, the fitted curves (red lines) follow the following equation: y = 100 × {1 + exp[−(k + xs)]}−1, where y represents the proportions of genetically identical or unique HIV-1 DNA p6-RT sequences, k represents the y intercept, s represents the coefficient calculated as log(OR), and x represents the years on ART. Each HIV-1 DNA sequence is the unit of analysis, and the denominator for each sequence is a single HIV-1-infected T cell (33, 73) The confidence interval of each data point was estimated from the binomial distribution. The odds ratios and their confidence intervals were estimated by logistic regression models.
FIG 17
FIG 17
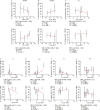
Genetically identical and unique HIV-1 DNA sequences from tissue-homing and tissue-derived CD4+ T cell subsets during ART. The effects of ART duration on the percentages of identical (top) and unique (bottom) HIV-1 DNA p6-RT sequences derived from CD4+ T cell subsets sorted from PB, LN, and gut tissues obtained from the CHI group are indicated as OR per year on therapy. The effects of ART duration on the proportions are shown in X5 R6+ (A) and X5+ R6 (B) cells sorted from PB; in TEM cells (C) sorted from the gut; and in TN (D), TCM (E), TTM (F), and TEM (G) cells sorted from LNs. The 95% confidence intervals for the ORs are indicated in square brackets. Estimated by mixed-effects logistic regression, the fitted curves (red lines) follow the following equation: y = 100 × {1 + exp[−(k + xs)]}−1, where y represents the proportions of genetically identical or unique HIV-1 DNA p6-RT sequences, k represents the y intercept, s represents the coefficient calculated as log(OR), and x represents the years on ART. Each HIV-1 DNA sequence is the unit of analysis, and the denominator for each sequence is a single HIV-1-infected T cell (33, 73). The confidence interval of each data point was derived from the binomial distribution. Odds ratios and their confidence intervals were estimated by logistic regression models.

Similar articles

Cited by

References

    1. Chun TW, Carruth L, Finzi D, Shen X, DiGiuseppe JA, Taylor H, Hermankova M, Chadwick K, Margolick J, Quinn TC, Kuo YH, Brookmeyer R, Zeiger MA, Barditch-Crovo P, Siliciano RF. 1997. Quantification of latent tissue reservoirs and total body viral load in HIV-1 infection. Nature 387:183–188. doi:10.1038/387183a0. - DOI - PubMed
    1. Chun TW, Finzi D, Margolick J, Chadwick K, Schwartz D, Siliciano RF. 1995. In vivo fate of HIV-1-infected T cells: quantitative analysis of the transition to stable latency. Nat Med 1:1284–1290. doi:10.1038/nm1295-1284. - DOI - PubMed
    1. Chun TW, Stuyver L, Mizell SB, Ehler LA, Mican JA, Baseler M, Lloyd AL, Nowak MA, Fauci AS. 1997. Presence of an inducible HIV-1 latent reservoir during highly active antiretroviral therapy. Proc Natl Acad Sci U S A 94:13193–13197. doi:10.1073/pnas.94.24.13193. - DOI - PMC - PubMed
    1. Finzi D, Hermankova M, Pierson T, Carruth LM, Buck C, Chaisson RE, Quinn TC, Chadwick K, Margolick J, Brookmeyer R, Gallant J, Markowitz M, Ho DD, Richman DD, Siliciano RF. 1997. Identification of a reservoir for HIV-1 in patients on highly active antiretroviral therapy. Science 278:1295–1300. doi:10.1126/science.278.5341.1295. - DOI - PubMed
    1. Wong JK, Hezareh M, Gunthard HF, Havlir DV, Ignacio CC, Spina CA, Richman DD. 1997. Recovery of replication-competent HIV despite prolonged suppression of plasma viremia. Science 278:1291–1295. doi:10.1126/science.278.5341.1291. - DOI - PubMed

Publication types