PD-1+ TIGIT+ CD8+ T cells are associated with pathogenesis and progression of patients with hepatitis B virus-related hepatocellular carcinoma
- PMID: 31720814
- PMCID: PMC11028102
- DOI: 10.1007/s00262-019-02426-5
PD-1+ TIGIT+ CD8+ T cells are associated with pathogenesis and progression of patients with hepatitis B virus-related hepatocellular carcinoma
Abstract
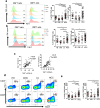
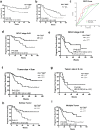
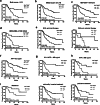
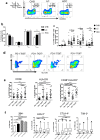
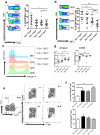
Hepatitis B virus-associated hepatocellular carcinoma (HBV-HCC) is usually considered an inflammation-related cancer associated with chronic inflammation triggered by exposure to HBV and tumor antigens. T-cell exhaustion is implicated in immunosuppression of chronic infections and tumors. Although immunotherapies that enhance immune responses by targeting programmed cell death-1(PD-1)/PD-L1 are being applied to malignancies, these treatments have shown limited response rates, suggesting that additional inhibitory receptors are also involved in T-cell exhaustion and tumor outcome. Here, we analyzed peripheral blood samples and found that coexpression of PD-1 and T-cell immunoglobulin and immunoreceptor tyrosine-based inhibitory motif (ITIM) domain (TIGIT) was significantly upregulated on CD4+ and CD8+ T cells from patients with HBV-HCC compared with those from patients with chronic HBV or HBV-liver cirrhosis. Additionally, PD-1+ TIGIT+ CD8+ T-cell populations were elevated in patients with advanced stage and progressed HBV-HCC. Importantly, PD-1+ TIGIT+ CD8+ T-cell populations were negatively correlated with overall survival rate and progression-free survival rates. Moreover, we showed that PD-1+ TIGIT+ CD8+ T cells exhibit features of exhausted T cells, as manifested by excessive activation, high expression of other inhibitory receptors, high susceptibility to apoptosis, decreased capacity for cytokine secretion, and patterns of transcription factor expression consistent with exhaustion. In conclusion, PD-1+ TIGIT+ CD8+ T-cell populations are associated with accelerated disease progression and poor outcomes in HBV-HCC, which might not only have important clinical implications for prognosis but also provide a rationale for new targets in immunotherapy.
Keywords: Coexpression; HCC; Prognosis; Programmed cell death-1; TIGIT.
Conflict of interest statement
The authors declare that they have no conflict of interests.
Figures
Similar articles
-
Prognostic and therapeutic potential of imbalance between PD-1+CD8 and ICOS+Treg cells in advanced HBV-HCC.Cancer Sci. 2024 Aug;115(8):2553-2564. doi: 10.1111/cas.16247. Epub 2024 Jun 15. Cancer Sci. 2024. PMID: 38877825 Free PMC article.
-
Peripheral immune characteristics of hepatitis B virus-related hepatocellular carcinoma.Front Immunol. 2023 Apr 3;14:1079495. doi: 10.3389/fimmu.2023.1079495. eCollection 2023. Front Immunol. 2023. PMID: 37077908 Free PMC article.
-
Blocking Tim-3 or/and PD-1 reverses dysfunction of tumor-infiltrating lymphocytes in HBV-related hepatocellular carcinoma.Bull Cancer. 2018 May;105(5):493-501. doi: 10.1016/j.bulcan.2018.01.018. Epub 2018 Mar 22. Bull Cancer. 2018. PMID: 29576222
-
Harnessing CD8+ T cell dynamics in hepatitis B virus-associated liver diseases: Insights, therapies and future directions.Clin Transl Med. 2024 Jul;14(7):e1731. doi: 10.1002/ctm2.1731. Clin Transl Med. 2024. PMID: 38935536 Free PMC article. Review.
-
Anti-PD-1/PD-L1 Blockade Immunotherapy Employed in Treating Hepatitis B Virus Infection-Related Advanced Hepatocellular Carcinoma: A Literature Review.Front Immunol. 2020 May 28;11:1037. doi: 10.3389/fimmu.2020.01037. eCollection 2020. Front Immunol. 2020. PMID: 32547550 Free PMC article. Review.
Cited by
-
Clinicopathological and Prognostic Value of Programmed Cell Death 1 Expression in Hepatitis B Virus-related Hepatocellular Carcinoma: A Meta-analysis.J Clin Transl Hepatol. 2021 Dec 28;9(6):889-897. doi: 10.14218/JCTH.2021.00056. Epub 2021 May 18. J Clin Transl Hepatol. 2021. PMID: 34966652 Free PMC article.
-
Prognostic and therapeutic potential of imbalance between PD-1+CD8 and ICOS+Treg cells in advanced HBV-HCC.Cancer Sci. 2024 Aug;115(8):2553-2564. doi: 10.1111/cas.16247. Epub 2024 Jun 15. Cancer Sci. 2024. PMID: 38877825 Free PMC article.
-
New insights into T-cell exhaustion in liver cancer: from mechanism to therapy.J Cancer Res Clin Oncol. 2023 Oct;149(13):12543-12560. doi: 10.1007/s00432-023-05083-5. Epub 2023 Jul 9. J Cancer Res Clin Oncol. 2023. PMID: 37423958 Review.
-
Peripheral immune characteristics of hepatitis B virus-related hepatocellular carcinoma.Front Immunol. 2023 Apr 3;14:1079495. doi: 10.3389/fimmu.2023.1079495. eCollection 2023. Front Immunol. 2023. PMID: 37077908 Free PMC article.
-
Advances in Immunotherapy for Hepatocellular Carcinoma (HCC).Curr Oncol. 2023 Nov 7;30(11):9789-9812. doi: 10.3390/curroncol30110711. Curr Oncol. 2023. PMID: 37999131 Free PMC article. Review.
References
-
- Torre LA, Bray F, Siegel RL, Ferlay J, Lortet-Tieulent J, Jemal A. Global cancer statistics, 2012. CA. 2015;65(2):87–108. - PubMed
MeSH terms
Substances
Grants and funding
LinkOut - more resources
Full Text Sources
Other Literature Sources
Medical
Research Materials

