. 2020 Feb;9(2):235-249.
doi: 10.1002/sctm.19-0092. Epub 2019 Nov 8.

Antibacterial activity of human mesenchymal stem cells mediated directly by constitutively secreted factors and indirectly by activation of innate immune effector cells

Affiliations

Antibacterial activity of human mesenchymal stem cells mediated directly by constitutively secreted factors and indirectly by activation of innate immune effector cells

Lyndah Chow et al. Stem Cells Transl Med. 2020 Feb.

Abstract

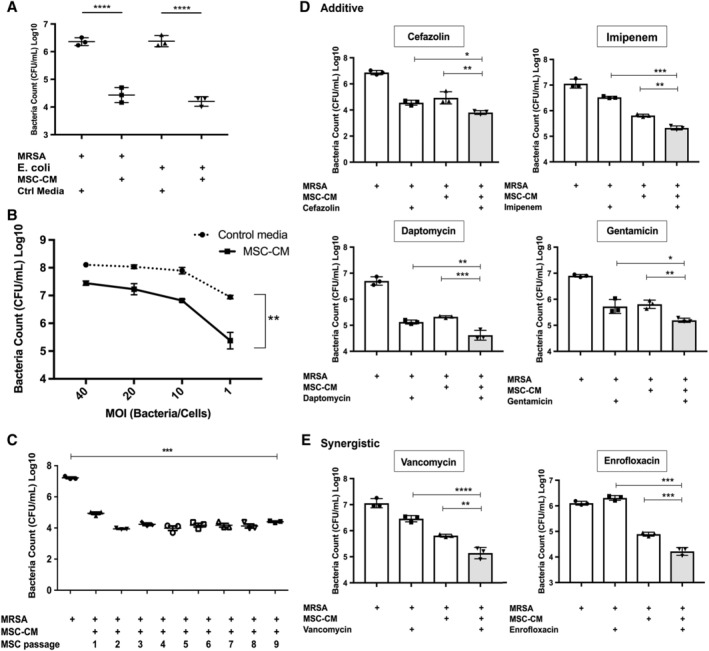
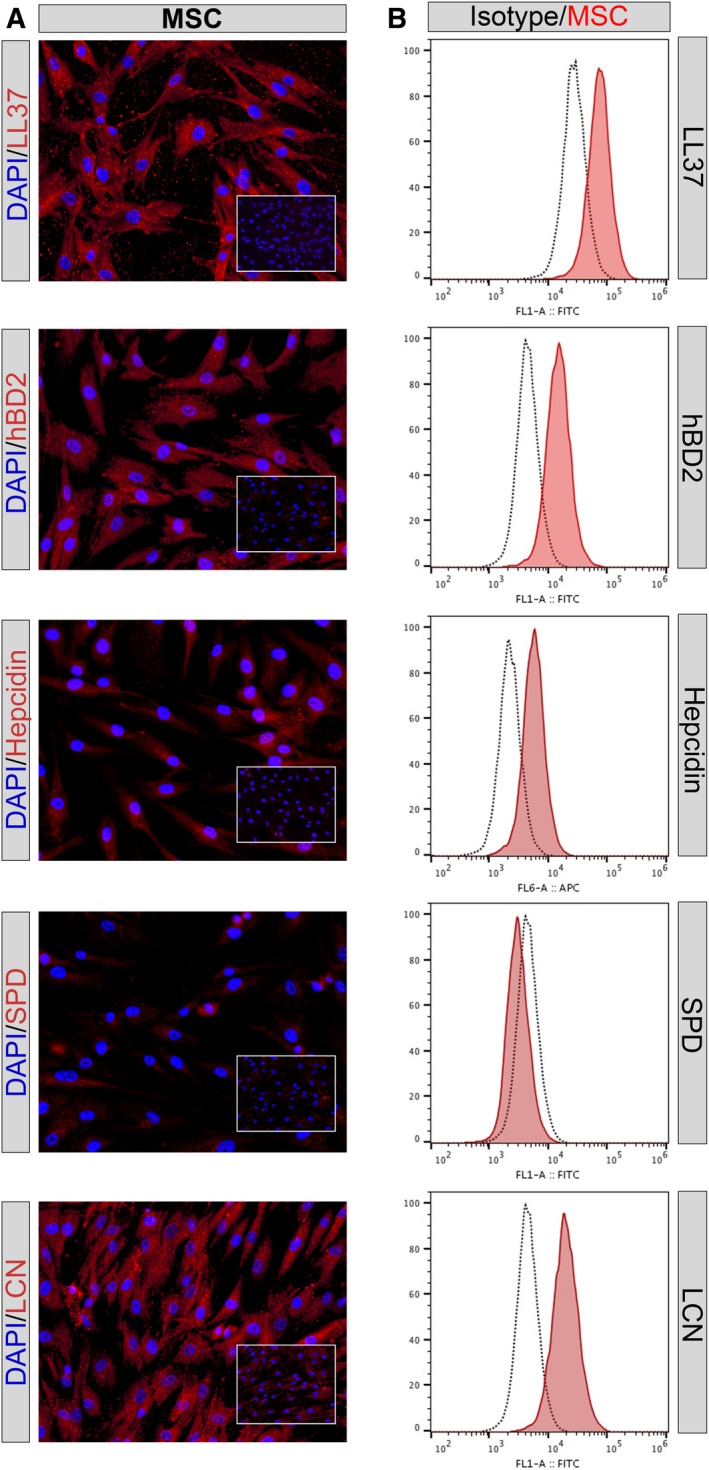
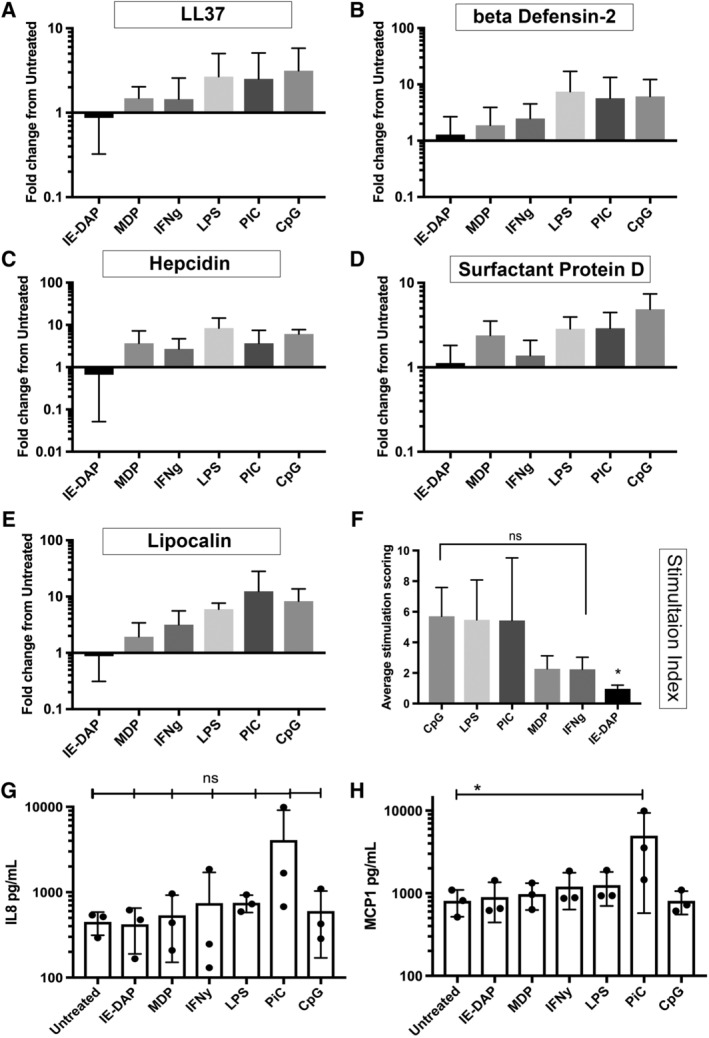
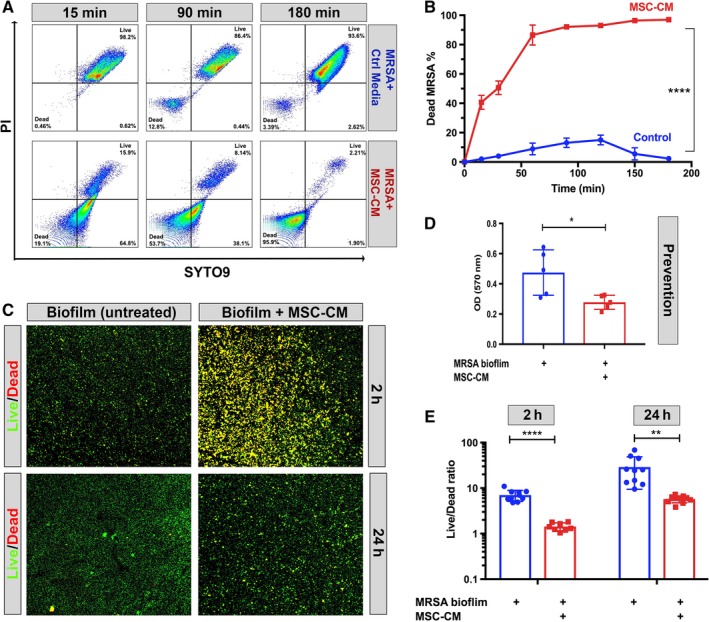
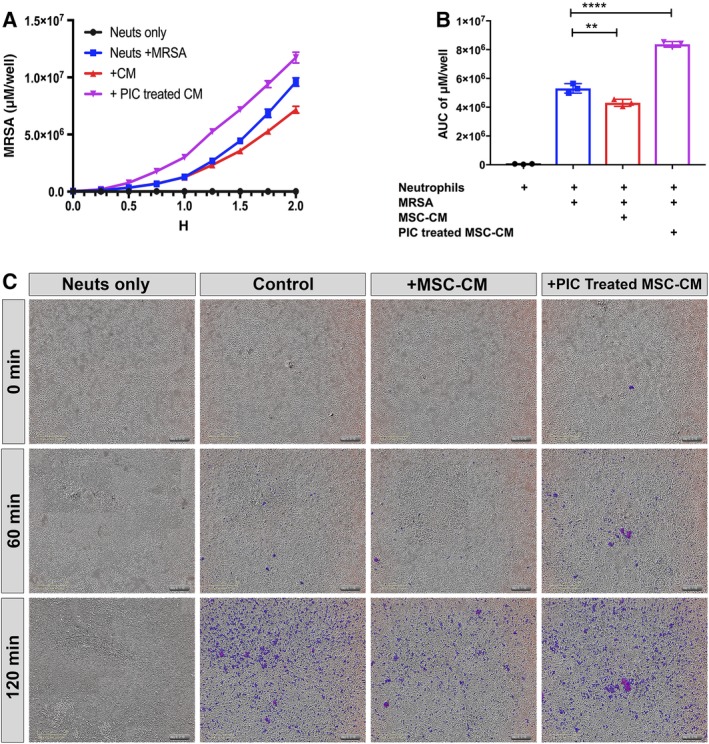
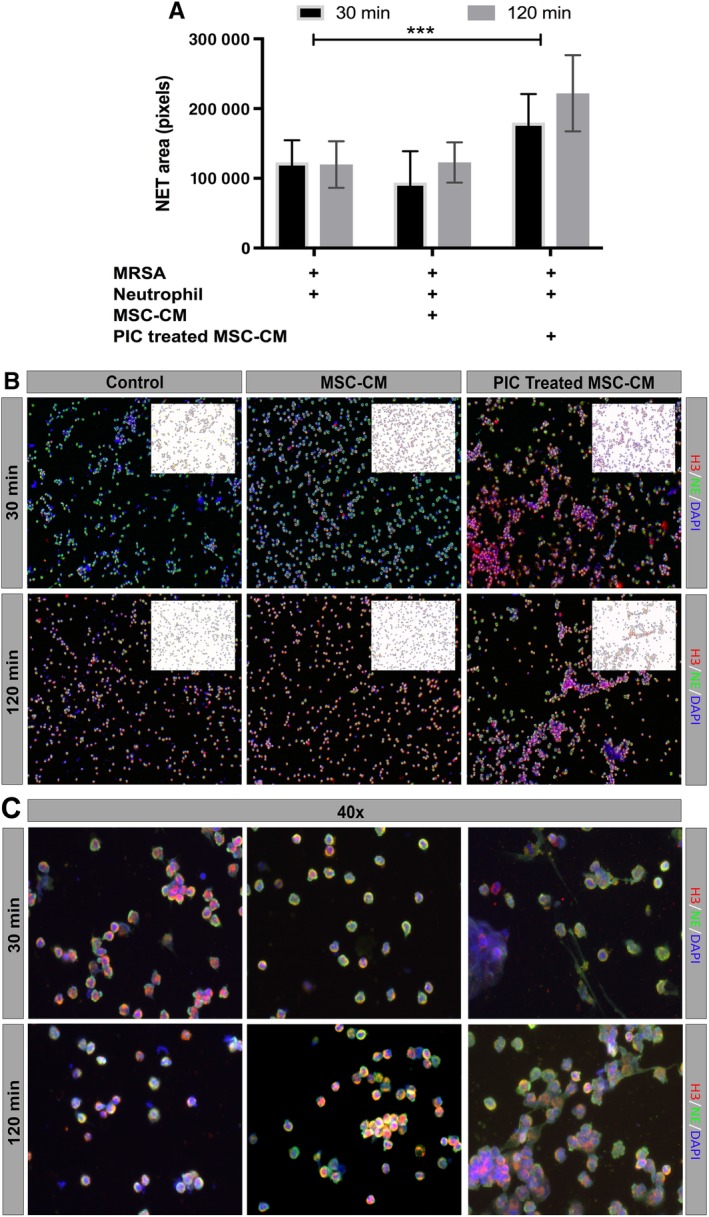
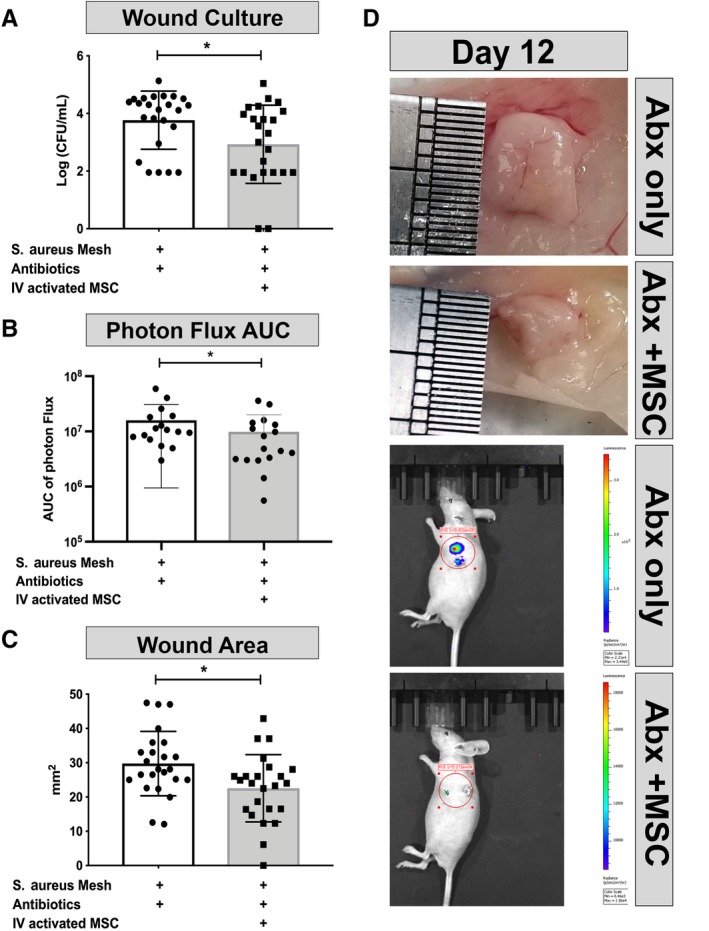
Mesenchymal stem cells (MSC) have been shown to improve wound healing and suppress inflammatory immune responses. Newer research also indicates that MSC exhibit antimicrobial activity, although the mechanisms underlying this activity have not been fully elucidated. Therefore, we conducted in vitro and in vivo studies to examine the ability of resting and activated MSC to kill bacteria, including multidrug resistant strains. We investigated direct bacterial killing mechanisms and the interaction of MSC with host innate immune responses to infection. In addition, the activity of MSC against chronic bacterial infections was investigated in a mouse biofilm infection model. We found that MSC exhibited high levels of spontaneous direct bactericidal activity in vitro. Moreover, soluble factors secreted by MSC inhibited Staphylococcus aureus biofilm formation in vitro and disrupted the growth of established biofilms. Secreted factors from MSC also elicited synergistic killing of drug-resistant bacteria when combined with several major classes of antibiotics. Other studies demonstrated interactions of activated MSC with host innate immune responses, including triggering of neutrophil extracellular trap formation and increased phagocytosis of bacteria. Finally, activated MSC administered systemically to mice with established S. aureus biofilm infections significantly reduced bacterial numbers at the wound site and improved wound healing when combined with antibiotic therapy. These results indicate that MSC generate multiple direct and indirect, immunologically mediated antimicrobial activities that combine to help eliminate chronic bacterial infections when the cells are administered therapeutically.

Keywords: antibacterial; cytokines; infection; neutrophil; peptides; stem cells.


Conflict of interest statement

S.D. declared patent ownership on a patent covering antimicrobial stem cell technology. All of the other authors declared no potential conflict of interest.

Figures

Figure 1
Figure 1
Direct antimicrobial activity of mesenchymal stem cells (MSC) and interaction with antibiotics in vitro. Conditioned medium (CM) from MSC was incubated with bacteria, as noted in the Materials and Methods section, to assess bactericidal activity. Data presented are representative of results obtained in three independent experiments using MSC from three different, unrelated donors. A, S. aureus and E. coli incubated with MSC CM. The y‐axis depicts bacterial colony counts (CFU/mL) in log scale. B, MSC CM incubated with increasing MOI of S. aureus. x‐axis shows depicts MOI, while dotted line represents bacterial growth when incubated with control media alone, solid line represents S. aureus CFU incubated with MSC CM. C, Bactericidal activity of MSC CM obtained from MSC at passages 1 through 9. For all figures statistical significance was determined for *P ≤ .05, **P ≤ .01, ***P ≤ .001, ****P ≤ .0001 as assessed by one‐way ANOVA and Tukey multiple means post‐test. Error bars depicting mean with SD in all panels. D, Interaction of MSC CM with antibiotics as expressed by bactericidal activity, using the bacterial killing assay (BKA) described in the Materials and Methods section. y‐axis shows bacterial count. Antibiotics with additive effect with MSC CM for bactericidal activity are depicted, including cefazolin, imipenem, daptomycin, and gentamycin. Gray Bars represent bacterial count with the addition of MSC CM and antibiotics. E, Two antibiotics (vancomycin and enrofloxacin) in which a positive synergistic interaction with MSC CM are depicted
Figure 2
Figure 2
Intracellular expression of antimicrobial peptides assessed by immunocytochemistry (ICC) and flow cytometry. A, Mesenchymal stem cells (MSC) were immunostained with antimicrobial peptide antibodies, as described in the Materials and Methods section. Positive binding of antibodies to intracellular peptides is depicted as red staining. Immunostaining with matched irrelevant isotype antibodies are shown in bottom right inset boxes. Images shown in ×20 magnification. B, Intracellular immunostaining of antimicrobial peptides in MSC, cathelicidin LL‐37, beta defensin (hBD2), hepcidin, surfactant protein D (SPD), and lipocalin (LcN) as assessed by flow cytometry. Mean fluorescence intensity on x‐axis. Intracellular immunostaining with irrelevant control isotype matched antibody (black dotted line), positive staining in red. Figures are representative of results obtained using three different donor MSC
Figure 3
Figure 3
Effects of mesenchymal stem cells (MSC) activation with TLR ligands and cytokines on antimicrobial peptide (AMP) expression, as assessed by RT‐PCR. Gene expression in response to in vitro activation with stimuli, as noted in the Materials and Methods section. Stimulant 1: γ‐D‐Glu‐mDAP (IE‐DAP) and a negative control muramyl dipeptide (MDP); Stimulant 2: cytokine IFN‐γ (IFNg); Stimulant 3: lipopolysaccharide (LPS); Stimulant 4: poly‐inosinic, poly‐cytidylic acid (pIC). Stimulant 5: type B CpG oligonucleotide (CpG). The y‐axis depicts fold change in gene expression, calculated using ddCT method32 normalized to un‐stimulated MSC and housekeeping gene GAPDH. A, LL37 expression; B, beta defensin2 expression; C, hepcidin expression; D, surfactant protein D expression; E, Lipocalin. Figures depict average fold change in AMP expression, as assessed in three donor MSC. Error bars depicting mean of three technical replicates from three donor MSC with SD. F, Stimulation index depicting average fold changes of the expression of five AMP genes, ranked in order of most to least effective AMP upregulation stimuli. Error bars depicting mean with SD. G, IL‐8 secretion in response to activation. MSC were activated with the stimuli noted, then conditioned medium (CM) was collected 24 hours later and IL‐8 concentrations were determined using an IL‐8 ELISA, as noted in the Materials and Methods section. H, MCP‐1 secretion in response to MSC activation. MSC were activated with the stimuli noted, then CM was collected 24 hours later and MCP‐1 concentrations were determined using a specific ELISA, as noted in the Materials and Methods section. Each point on the cytokine graphs represents the mean of three technical replicates obtained from MSC generated from three different donors. * denotes P < .05 as assessed by ANOVA and Tukey multiple means post‐test
Figure 4
Figure 4
Killing of planktonic and biofilm bacteria by mesenchymal stem cells (MSC) conditioned medium (CM) as assessed by cell membrane permeability assay and immunocytochemical staining. A, Bacterial killing of S. aureus (USA‐300 strain) in the planktonic phase of growth was quantitated using the LIVE/DEAD BacLight kit for quantitation of bacterial cell membrane permeability, as noted in the Materials and Methods section. Representative flow cytometry plots from time points pretreatment, 15, 90, and 180 minutes after incubation with MSC CM. Dead and live quadrants are labeled in bottom left and top right. Figures are representations of results obtained from three different donor MSC CM. B, Percentage of dead bacteria as determined by flow cytometry at different time points, MSC CM incubated bacteria shown as the red line, whereas control medium depicted as blue line. Error bars represent mean and SD from three replicates. C, Bacteria (USA‐300) grown as biofilms were incubated with control medium and MSC CM for the indicated time points, then stained with LIVE/DEAD BacLight kit as described in the Materials and Methods section to identify live and dead bacterial colonies, as revealed by immunohistochemical staining and evaluation by confocal microscopy. Green (SYTO9) represents live bacterial clusters, whereas red clusters represent dead bacteria stained with propidium iodide. Merged channels show yellow color as red and green overlap. Right column “MSC‐CM” shows MRSA biofilm incubated for 2 (top) or 24 (bottom) hour with MSC conditioned medium. Left column “MRSA biofilm” grown in DMEM medium only with additives matched to MSC‐CM. Images taken with ×10 objective. 4D, Prevention of biofilm formation by MSC CM (compared with control medium) as assessed using S. aureus biofilm assays, as noted in the Materials and Methods section. The Y axis depicts bacterial colonies, quantitated using crystal violet staining after 72 hours in culture. Blue shows the biofilm grown in DMEM media with all additives, red shows biofilm with the addition of MSC CM. E, Effects of MSC CM on pre‐formed biofilms following 2 or 24 hours of exposure. Bars depict the ratio of live vs dead bacteria in biofilms, as quantitated using ImageJ software, as described in the Materials and Methods section. Statistical significance was determined for *P ≤ .05, **P ≤ .01, ***P ≤ .001, ****P ≤ .0001 as assessed by one‐way ANOVA and Tukey multiple means post‐test. Each experiment was conducted using CM from three different donor MSC. The figures depicted are representative of the results obtained in three independent experiments
Figure 5
Figure 5
Effects of mesenchymal stem cells (MSC) conditioned medium (CM) on neutrophil phagocytosis. A, Neutrophils obtained from healthy donors were incubated with MSC CM to assess the effects on bacterial phagocytosis, using methicillin‐resistant S. aureus (MRSA) bacteria labeled with the pH red dye, as described in the Materials and Methods section. The x‐axis depicts time of incubation of neutrophils with bacteria (hours), while the Y axis depicts phagocytosed bacteria, quantitated as the average μM per well. Color legend for each conditions are shown in top right. B, Area under curve calculations of total phagocytosed bacteria over a 2‐hour time period are depicted. Control neutrophils (no bacteria) depicted in black, control neutrophils with bacteria only (blue), neutrophils incubated with MSC CM (red), and neutrophils incubated with pIC (Poly I:C) activated MSC CM (purple). The AUC was calculated using the Prism 7 software. Statistical significance was determined for *P ≤ .05, **P ≤ .01, ***P ≤ .001, ****P ≤ .0001 as assessed by one‐way ANOVA and Tukey multiple means post‐test. C, Representative photos obtained from the IncuCyte ZOOM system from neutrophils incubated for 0, 1, and 2 hours following addition of labeled S. aureus, for each of the four conditions tested. Purple indicates phagocytosed bacteria. Scale bar shown in yellow in bottom left corner of each panel
Figure 6
Figure 6
Effects of mesenchymal stem cells (MSC) conditioned medium (CM) on neutrophil extracellular trap (NET) formation. A, Neutrophils were incubated with MSC CM or medium, then incubated with live S. aureus for 30 minutes or 2 hours, as noted in the Materials and Methods section, then fixed and immunostained for detection and quantitation of NET formation, using confocal microscopy. Total NET area was normalized to DAPI cell count, and was digitized and quantitated using ImageJ software, as described in the Materials and Methods section. Bars depict the total area at 30 minutes (black) or 2 hours (gray) following exposure to S. aureus. *** denotes P < .0005 as assessed by ANOVA and Tukey multiple means post‐test. Each experiment was conducted using MSC CM obtained from three different donor MSC, and neutrophils were collected from three unrelated healthy donors. B, Representative ×10 magnification images of NET formation by neutrophils 30 minutes (top row) or 2 hours (bottom row) after exposure to S. aureus. Red, green, and blue depict histone H3, neutrophil elastase, and DAPI expression, respectively. The upper right corner of each image depicts shows NET total area, calculated by Image J software, with colors inverted for clarity. C, Representative ×40 magnification images of neutrophil NETs, imaged under same conditions as described for (B)
Figure 7
Figure 7
Treatment of chronic biofilm infection by activated mesenchymal stem cells (MSC). Mice (n = 6 per group) were implanted with S. aureus infected mesh, then treated with activated MSC and amoxi‐clav, or amoxi‐clav only, as described in the Materials and Methods section. A, Bacterial bioburden in wound tissues (CFU/wound tissue) at the end of the 12 day study. Results pooled from four independent experiments. B, Luminescent imaging of wound bioburden, determined using an IVIS unit, and converted to area under the curve (AUC) Results pooled from three independent experiments. C, Mean measured wound area (mm2) for each treatment group of mice. Results pooled from four independent experiments. D, Representative digital camera images of wound tissues immediately following euthanasia, obtained from treated and control mice. Lower two images showing representative IVIS imaging from treated and control mice. With red circle showing the field used to calculate radiance in ROI, radiance color scale shown in right bar. * denotes P < .05 as assessed by two tailed nonparametric t test and Mann‐Whitney post‐test

Similar articles

Cited by

References

    1. Ventola CL. The antibiotic resistance crisis: part 1: causes and threats. P T. 2015;40:277‐283. - PMC - PubMed
    1. McGuinness WA, Malachowa N, DeLeo FR. Vancomycin resistance in Staphylococcus aureus . Yale J Biol Med. 2017;90:269‐281. - PMC - PubMed
    1. Arciola CR, Campoccia D, Montanaro L. Implant infections: adhesion, biofilm formation and immune evasion. Nat Rev Microbiol. 2018;16:397‐409. - PubMed
    1. Johnson V, Webb T, Norman A, et al. Activated mesenchymal stem cells interact with antibiotics and host innate immune responses to control chronic bacterial infections. Sci Rep. 2017;7:9575. - PMC - PubMed
    1. Alcayaga‐Miranda F, Cuenca J, Khoury M. Antimicrobial activity of mesenchymal stem cells: current status and new perspectives of antimicrobial peptide‐based therapies. Front Immunol. 2017;8:339. - PMC - PubMed

Publication types

MeSH terms

Substances