. 2019 Dec 13;294(50):19381-19394.
doi: 10.1074/jbc.RA119.010172. Epub 2019 Nov 7.

Independent tubulin binding and polymerization by the proline-rich region of Tau is regulated by Tau's N-terminal domain

Affiliations

Independent tubulin binding and polymerization by the proline-rich region of Tau is regulated by Tau's N-terminal domain

Kristen M McKibben et al. J Biol Chem. .

Abstract

Tau is an intrinsically disordered, microtubule-associated protein that has a role in regulating microtubule dynamics. Despite intensive research, the molecular mechanisms of Tau-mediated microtubule polymerization are poorly understood. Here we used single-molecule fluorescence to investigate the role of Tau's N-terminal domain (NTD) and proline-rich region (PRR) in regulating interactions of Tau with soluble tubulin. We assayed both full-length Tau isoforms and truncated variants for their ability to bind soluble tubulin and stimulate microtubule polymerization. We found that Tau's PRR is an independent tubulin-binding domain that has tubulin polymerization capacity. In contrast to the relatively weak interactions with tubulin mediated by sites distributed throughout Tau's microtubule-binding region (MTBR), resulting in heterogeneous Tau: tubulin complexes, the PRR bound tubulin tightly and stoichiometrically. Moreover, we demonstrate that interactions between the PRR and MTBR are reduced by the NTD through a conserved conformational ensemble. On the basis of these results, we propose that Tau's PRR can serve as a core tubulin-binding domain, whereas the MTBR enhances polymerization capacity by increasing the local tubulin concentration. Moreover, the NTD appears to negatively regulate tubulin-binding interactions of both of these domains. The findings of our study draw attention to a central role of the PRR in Tau function and provide mechanistic insight into Tau-mediated polymerization of tubulin.

Keywords: Alzheimer's disease; cytoskeleton; fluorescence correlation spectroscopy (FCS); intrinsically disordered protein; microtubule-associated protein (MAP); single-molecule FRET; single-molecule biophysics; tau protein (tau); tauopathy; tubulin polymerization.


Conflict of interest statement

The authors declare that they have no conflicts of interest with the contents of this article. The content is solely the responsibility of the authors and does not necessarily represent the official views of the National Institutes of Health

Figures
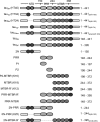
Figure 1.
Figure 1.
Schematics of Tau constructs. The uppermost schematic shows the longest Tau isoform, tau2N. The domains and corresponding residues that delineate them are marked: the NTD with N-terminal inserts (N1 and N2), the PRR with subregions (P1 and P2), and the MTBR with four imperfect repeat sequences (R1–R4) flanked by the pseudo-repeat R' and the C terminus. Shown below are the additional Tau isoforms and truncated variants used in this study. All numbering of residues throughout the manuscript is based on tau2N. The nomenclature from Ref. is shown in parentheses for relevant constructs. The corresponding amino acids for each construct with deletions subscripted are given.
Figure 2.
Figure 2.
SmFRET of Tau N-terminal isoforms. A, schematic of the reference construct tau2N, with residues labeled for smFRET measurements indicated. B, SmFRET histograms of tau2N, tau1N, tau1N*, and tau0N in the absence (dark, left axis) and presence (light, right axis) of 10 μm tubulin. Labeling positions are indicated at the top of each column. The histograms are fit to a sum of Gaussian distributions to determine the mean ETeff as detailed under “Experimental procedures.” Measurements were carried out in phosphate buffer (pH 7.4) at 20 °C. C, RMSexp were plotted in the absence (left) and presence (right) of 10 μm tubulin (53). Shaded regions indicate RMSexp that are too large to be determined accurately by the Alexa 488–Alexa 594 fluorophore pair. For reference, the RMS calculated for a random coil (RMSRC) as in Ref. is indicated by the gray dashed line. Data are presented as mean ± S.D. n ≥ 3 independent measurements. See Table 2 for numerical values of ETeff ± S.D., RMSexp ± S.D., and RMSRC for each construct.
Figure 3.
Figure 3.
Inhibition of tubulin binding by the NTD. The increase in τnorm as a function of tubulin concentration reflects binding of fluorescently labeled Tau to unlabeled tubulin. All measurements were carried out in phosphate buffer (pH 7.4) at 20 °C. Data are presented as mean ± S.D., n ≥ 3 independent measurements. See “Experimental procedures” for details regarding data analysis. See Table 3 for numerical values for τD and τnorm at 10 μm tubulin and the labeling position for each construct.
Figure 4.
Figure 4.
Regulation of Tau:tubulin complex heterogeneity by the NTD. A, individual autocorrelation curves (gray dots) are plotted for tau2N (right) and PRR-MTBR-R' (left) in the presence of 10 μm tubulin. Averaged curves are indicated by colored dots, and fits of the averaged curves to Equation 2 are shown in black. Data plotted represent all collected curves from independent triplicate measurements measured on different days. B, the autocorrelation curves from A were fit individually to obtain a distribution of τD and CPM (kilohertz) values. When the NTD is absent, larger Tau:tubulin complexes form, as seen by the larger values of τD containing additional Tau molecules, as indicated by the increase in CPM (kilohertz). Measurements were carried out in phosphate buffer (pH 7.4) at 20 °C. See Table 3 for labeling positions of constructs.
Figure 5.
Figure 5.
Impact of NTD inserts N1 and N2 on binding and polymerization. A, the increase in τnorm as a function of tubulin concentration reflects binding of fluorescently labeled Tau to unlabeled tubulin. Data are presented as mean ± S.D., n ≥ 3 independent measurements. See Table 3 for numerical values for τD and τnorm at 10 μm tubulin. For comparison, tau2N and PRR-MTBR-R' from Fig. 3 are replotted. B, the autocorrelation curves for tau2N, tau1N, tau1N*, tau0N, and PRR-MTBR-R' in the presence of 10 μm tubulin were fit individually to obtain a distribution of τnorm values. Each individual τD was converted to τnorm by the average τD of each independent measurement (Table 3). When the NTD is absent, larger Tau:tubulin complexes form, as seen by the larger values of τnorm. Overlays are lognormal distributions. See Table 3 for labeling positions of constructs and Table 4 for descriptive statistics of distributions. Measurements were carried out in phosphate buffer (pH 7.4) at 20 °C. See “Experimental procedures” for details regarding data analysis. C, tubulin polymerization as measured by scattered light at 340 nm as a function of time. Measurements were made in phosphate buffer (pH 6.9) with 1 mm GTP at 37 °C with 5 μm Tau and 10 μm tubulin. See Table 5 for fit parameters. Data are presented as mean ± S.D. following normalization; n = 3 independent measurements. See “Experimental procedures” for details regarding data analysis. Arrows indicate depolymerization at 4 °C.
Figure 6.
Figure 6.
Independent polymerization capacity of the PRR, regulated by the NTD. A, binding of Tau constructs to tubulin as measured by an increase in τnorm as a function of tubulin concentration. Data are presented as mean ± S.D., n ≥ 3 independent measurements. Measurements were carried out in phosphate buffer (pH 7.4) at 20 °C. See Table 3 for labeling positions of constructs and Table 4 for descriptive statistics of distributions. See “Experimental procedures” for details regarding data analysis. The PRR data are fit with the Hill equation (orange line, Equation 1), yielding n = 1.7 ± 0.2 and an apparent KD ≈ 900 nm. B, tubulin polymerization as measured by scattered light at 340 nm as a function of time. Measurements were made in phosphate buffer (pH 6.9) with 1 mm GTP at 37 °C with 10 μm Tau and 10 μm tubulin. See Table 5 for fit parameters. Data are presented as mean ± S.D. following normalization, n = 3 independent measurements. Arrows indicate depolymerization at 4 °C. C, TEM images of microtubules formed by PRR-tubulin polymerization reaction, as in B (left and center panels), and the tubulin-only control (right panel). The region outlined in white in the left panel is shown at higher magnification in the center panel.
Figure 7.
Figure 7.
The PRR forms stoichiometric complexes with tubulin. A, binding of Tau constructs to tubulin as measured by an increase in τnorm as a function of tubulin concentration. Data are presented as mean ± S.D., n ≥ 3 independent measurements. P1 and P2 bind only weakly but are comparable with or stronger than MTBR. Measurements were made in phosphate buffer (pH 7.4) at 20 °C. See Table 3 for labeling positions of constructs. For comparison, PRR and MTBR are replotted from Fig. 6A. B, the autocorrelation curves for PRR and PRR-MTBR-R' were fit individually to obtain a distribution of τnorm values at each tubulin concentration. Each individual τD was converted to τnorm by the average τD of each independent measurement (Table 3). Unlike PRR-MTBR-R', which forms tubulin concentration–dependent large complexes at tubulin concentrations exceeding ∼1 μm, PRR binding saturates and does not form large complexes. Data plotted represent all collected curves from independent triplicate measurements on different days. See “Experimental procedures” for details regarding data analysis.
Figure 8.
Figure 8.
Model for regulation of Tau:tubulin interactions. The PRR (orange) binds tubulin tightly and stoichiometrically, negatively regulated by the NTD (blue). The MTBR-R' (red) increases the local tubulin concentration through distributed weak interactions, enhancing the polymerization capacity of Tau. The C terminus is colored black. Increasing both Tau and tubulin concentrations favors polymerization.

Similar articles

Cited by

References

    1. Weingarten M. D., Lockwood A. H., Hwo S. Y., and Kirschner M. W. (1975) A protein factor essential for microtubule assembly. Proc. Natl. Acad. Sci. U.S.A. 72, 1858–1862 10.1073/pnas.72.5.1858 - DOI - PMC - PubMed
    1. Drubin D. G., and Kirschner M. W. (1986) Tau protein function in living cells. J. Cell Biol. 103, 2739–2746 10.1083/jcb.103.6.2739 - DOI - PMC - PubMed
    1. Guo T., Noble W., and Hanger D. P. (2017) Roles of tau protein in health and disease. Acta Neuropath. 133, 665–704 10.1007/s00401-017-1707-9 - DOI - PMC - PubMed
    1. Ballatore C., Lee V. M., and Trojanowski J. Q. (2007) Tau-mediated neurodegeneration in Alzheimer's disease and related disorders. Nat. Rev. Neurosci. 8, 663–672 10.1038/nrn2194 - DOI - PubMed
    1. Winklhofer K. F., Tatzelt J., and Haass C. (2008) The two faces of protein misfolding: gain- and loss-of-function in neurodegenerative diseases. EMBO J. 27, 336–349 10.1038/sj.emboj.7601930 - DOI - PMC - PubMed

Publication types

LinkOut - more resources